Predicting the heat over western Europe in the summer of 2022
Linus Magnusson, Ivan Tsonevsky, Estibaliz Gascon, Rebecca Emerton, Emmanuel Rouges
During the summer of 2022, Europe saw several heatwaves and much drier conditions than normal in western Europe. For example, on 19 July the UK for the first time reached temperatures above 40°C. Other parts of the northern hemisphere also saw extreme weather this summer, with severe flooding in Pakistan (see the article by Antje Weisheimer et al. in this Newsletter) and severe droughts in parts of China.
Extended-range forecasts
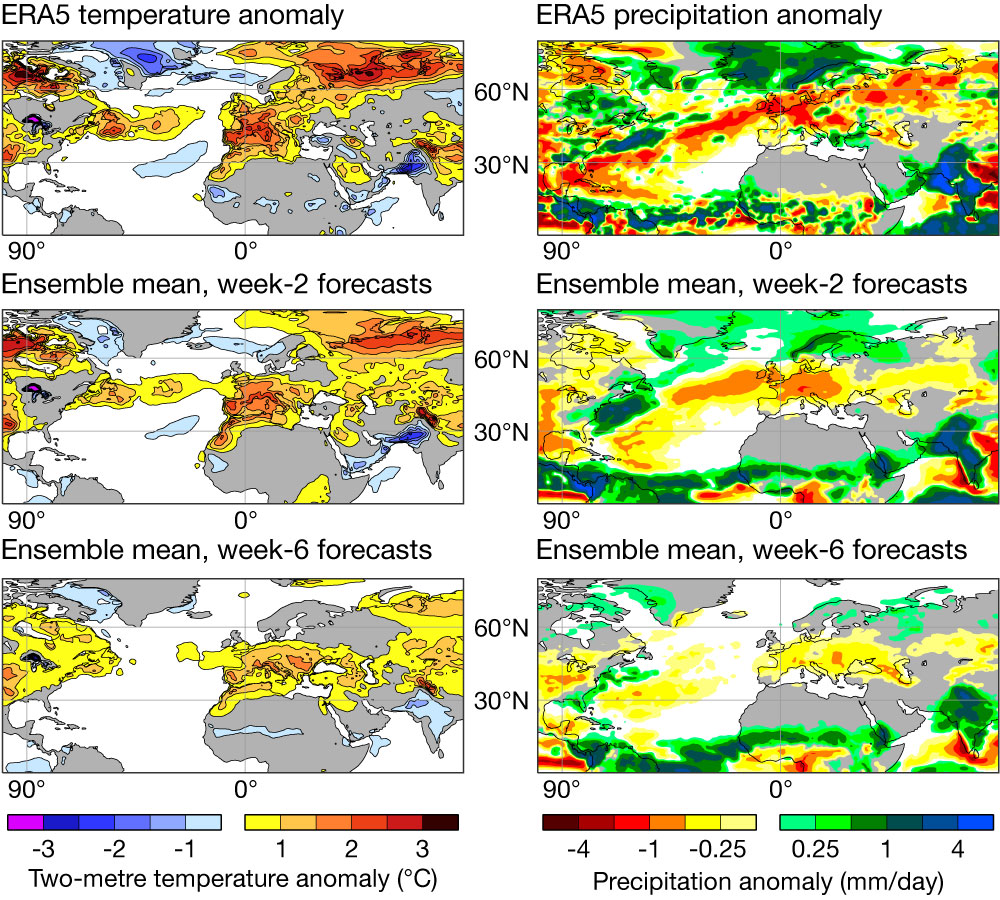
How well did ECMWF’s extended-range forecasts predict the anomalous weather this summer? To answer this question, the first figure shows composites of weekly temperature and precipitation anomalies for the period 6 June to 28 August from the ERA5 reanalysis, and of all ensemble mean forecasts that verified during that period, with different lead times. For 2‑metre temperature, the strong anomaly over western Europe is evident in ERA5 as well as in the composite of week‑2 forecasts. In the week‑6 composite, the warm anomaly over western Europe is still present, but it is weaker.
%3Cstrong%3ETwo-metre%20temperature%20and%20precipitation%20anomalies.%3C/strong%3E%20Composites%20of%20weekly%202-metre%20temperature%20anomalies%20(left)%20and%20precipitation%20anomalies%20(right)%20for%20the%20weeks%20commencing%206%20June%20to%2028%20August%20from%20the%20ERA5%20reanalysis%20(top),%20the%20ensemble%20mean%20from%20week-2%20forecasts%20(middle),%20and%20the%20ensemble%20mean%20from%20week-6%20forecasts%20(bottom).Two-metre temperature and precipitation anomalies. Composites of weekly 2-metre temperature anomalies (left) and precipitation anomalies (right) for the weeks commencing 6 June to 28 August from the ERA5 reanalysis (top), the ensemble mean from week-2 forecasts (middle), and the ensemble mean from week-6 forecasts (bottom).
Regarding precipitation (right-hand side of the first figure), the dry anomaly over western Europe was well predicted in week‑2 forecasts and seems to be connected to a drier-than-normal band from Florida up to western Europe. This pattern, alongside the anomalously active Indian monsoon and consequent flooding in Pakistan, was captured in the week‑6 forecasts.
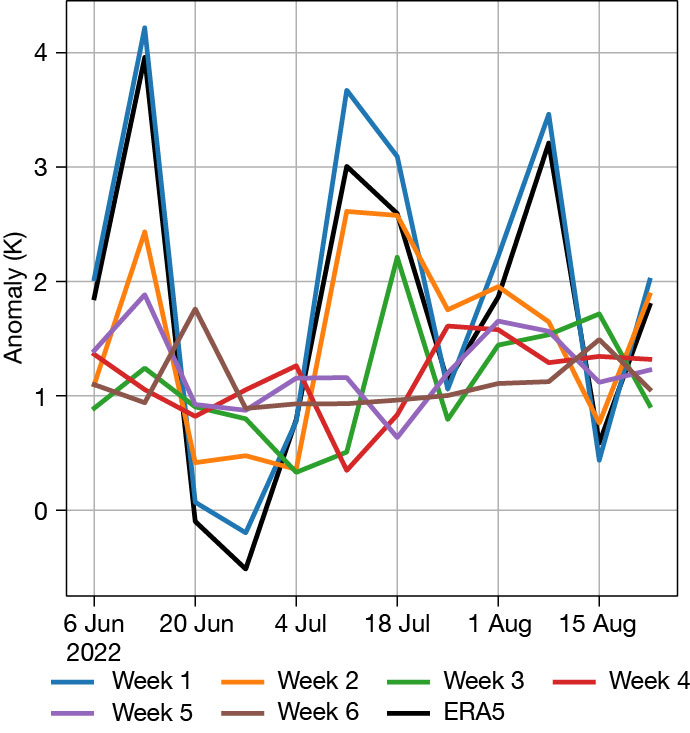
Looking at a time series of the weekly average temperature over western Europe from ERA5 (second figure, black), three heatwaves are apparent. All lead times shown predicted a warmer-than-normal summer, but it was only the week‑1 and week‑2 forecasts that captured the intra-seasonal variability in terms of ensemble mean. Week‑3 forecasts showed some intra-seasonal variability but with a delayed signal.
%3Cstrong%3EWeekly%20anomalies%20of%202-metre%20temperature%20over%20western%20Europe.%3C/strong%3E%20The%20chart%20shows%20weekly%20anomalies%20in%20the%20ERA5%20reanalysis%20and%20according%20to%20ECMWF%20extended-range%20forecasts%20one%20to%20six%20weeks%20ahead%20over%20land%20points%20inside%2035%C2%B0N%E2%80%9355%C2%B0N%20and%2015%C2%B0W%E2%80%9310%C2%B0E.Weekly anomalies of 2-metre temperature over western Europe. The chart shows weekly anomalies in the ERA5 reanalysis and according to ECMWF extended-range forecasts one to six weeks ahead over land points inside 35°N–55°N and 15°W–10°E.
Medium-range forecasts for the July heatwave
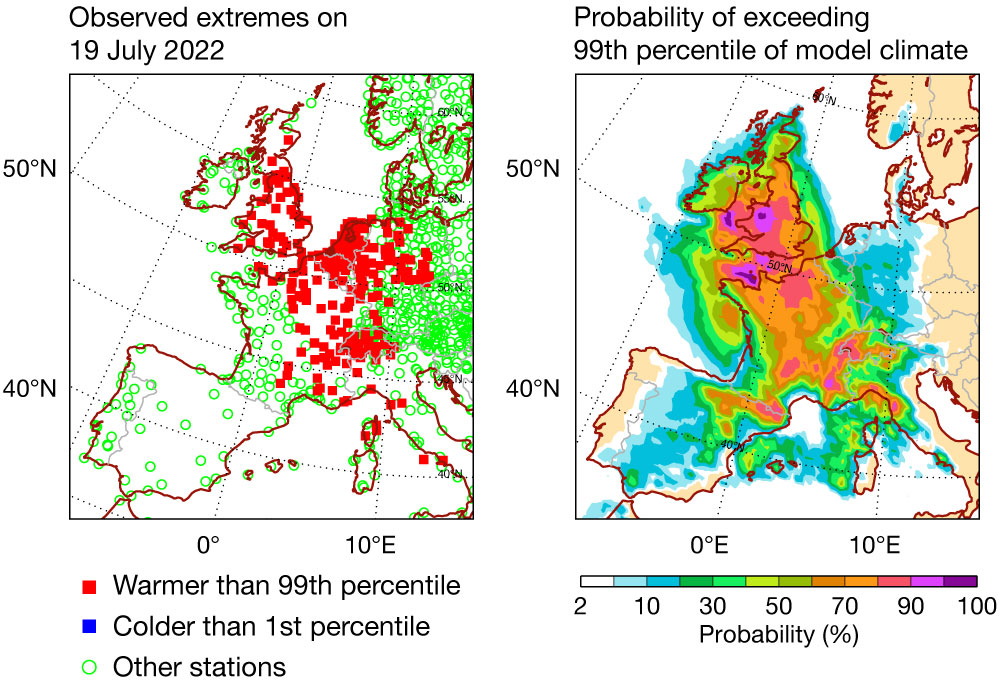
Focusing on the extreme period when the UK record was set, the heatwave started from the Iberian Peninsula on 17 July and moved north-east to reach Germany and southern Scandinavia on 20 July. The third figure (left) shows the SYNOP stations where the maximum temperature on 19 July exceeded the 99th percentile of the climatology, when the heatwave covered the United Kingdom and large parts of north-western Europe. The spatial extent of the heatwave was well predicted in the forecast from 13 July, as is visualised by showing the probability of exceeding the 99th percentile of the model climatology in the right-hand panel.
%3Cstrong%3EMaximum%202-metre%20temperature%20on%2019%20July%20in%20the%2099th%20percentile%20of%20climatology.%3C/strong%3E%20The%20left-hand%20chart%20shows%20observations%20warmer%20than%20the%2099th%20percentile%20(red),%20colder%20than%20the%201st%20percentile%20(blue)%20and%20other%20stations%20(green),%20while%20the%20right-hand%20chart%20shows%20the%20probability%20of%20exceeding%20the%2099th%20percentile%20of%20the%20model%20climate%20on%2019%20July%20in%20a%20forecast%20from%2013%20July%2000%20UTC.Maximum 2-metre temperature on 19 July in the 99th percentile of climatology. The left-hand chart shows observations warmer than the 99th percentile (red), colder than the 1st percentile (blue) and other stations (green), while the right-hand chart shows the probability of exceeding the 99th percentile of the model climate on 19 July in a forecast from 13 July 00 UTC.
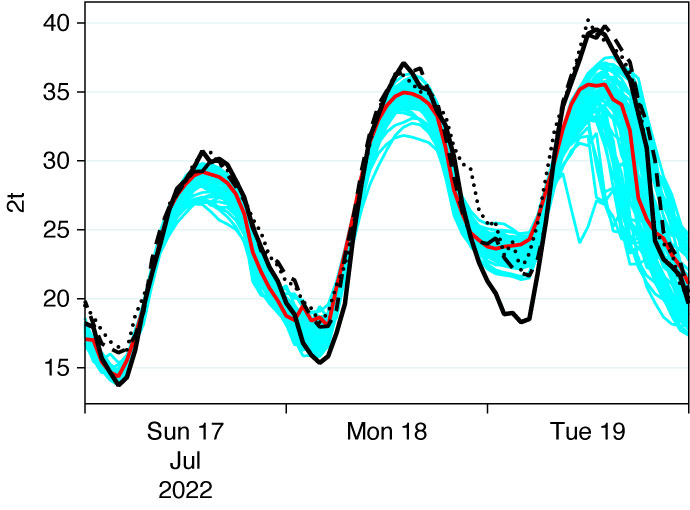
For the prediction of the heatwave, we here focus on maximum temperatures in London on 19 July, when London-Heathrow and St James’s Park in central London reached 40.2°C and London-Northolt measured 40.0°C. The ensemble median in both medium-range and short-range forecasts was well above the model climatology, with around 35°C (and similar values for the high-resolution forecast). However, this was far below the observed values. To further evaluate a specific forecast, we show the 3‑day forecast from 17 July based on hourly values for these locations. Note that the maximum reported station value is based on continuous observations while the values here are the hourly SYNOP. For this 3‑day period, the temperature was rising. This was captured by the forecasts. For the daily minimum, the forecasts captured the extremes well for Heathrow and St James’s Park and overestimated the temperature at Northolt, which was colder than the other two stations. For the daily maximum temperature, we see that the forecast underestimated the peak for all three stations and all three days. For the hottest day, none of the ensemble members were close to reaching the maximum temperature at any of the three observation stations. This too low amplitude of the diurnal cycle is a recurring feature during heatwaves.
%3Cstrong%3EForecast%20for%202-metre%20temperature%20from%2017%20July%20for%20London%20and%20corresponding%20observations.%3C/strong%3E%20The%20chart%20shows%20the%20high-resolution%20forecast%20(red),%20ensemble%20members%20(cyan),%20and%20three%20observation%20stations%20(Northolt%20%E2%80%93%20black%20solid,%20St%20James%E2%80%99s%20Park%20%E2%80%93%20black%20dashed,%20Heathrow%20%E2%80%93%20black%20dotted).Forecast for 2-metre temperature from 17 July for London and corresponding observations. The chart shows the high-resolution forecast (red), ensemble members (cyan), and three observation stations (Northolt – black solid, St James’s Park – black dashed, Heathrow – black dotted).
Summary
To summarise the skill of forecasts for European heatwaves in the summer of 2022 on different timescales, a signal for a warmer-than-normal summer was consistently present in 6‑week forecasts from the extended-range system. On a 2‑week timescale, the forecast started to distinguish between the extreme weeks and the more normal weeks. However, regarding the example of the record-breaking day over the UK, the forecasts failed to capture the magnitude of the extreme. These conclusions are similar to heatwaves in 2015, 2018 and 2019, also reported in ECMWF Newsletters.
From the predictability perspective, an area for further research is the relationship between European heatwaves and other extremes over the northern hemisphere, such as the precipitation anomaly over Pakistan/northwest India. In 2010, Pakistan also experienced flooding while western Russia had a severe heatwave. The relationship between these two regions has been investigated in the EU’s Horizon 2020 CAFE project, where a connection between the BSISO index (as a proxy for the monsoon) and Russian heatwaves was established, while the connection to western Europe is less clear.