Aeolus, the European Space Agency’s (ESA) novel Earth Explorer satellite, retrieves profiles of horizontal wind information in the troposphere and lower stratosphere via a Doppler wind lidar instrument. The mission is a ‘proof of concept’, and our understanding of the measurement characteristics and usage has evolved rapidly since launch in 2018.
Direct observations of wind profiles have limited spatial coverage in the global observing system. Therefore, by partly filling this gap, Aeolus provides an important contribution of such information in numerical weather prediction (NWP) and improves the initial conditions of forecasts. We assess the impact of Aeolus horizontal line-of-sight (HLOS) winds from the best dataset available so far – the second reprocessed dataset covering a 15‑month period during 2019 and 2020. Aeolus wind processing algorithms have improved during the mission, and hence reprocessing the data improves quality. The largest signal-to-noise ratio of the mission was available during the early part of this period. A good positive impact is shown for a single space-based instrument: improving wind, temperature and humidity forecasts by up to 1–2% in the medium forecast range in the lower stratosphere, with smaller but still statistically significant improvements at lower altitudes. In 2019, Aeolus also provided up to 5% of the short-range forecast impact partitioned by observation type. Gradual degradation of the signal-to-noise ratio due to instrument issues is responsible for a reduction in the impact of Aeolus in 2022. The operational impact from Aeolus will be an important consideration when assessing a future operational Doppler wind lidar mission to be run by the European Organisation for the Exploitation of Meteorological Satellites (EUMETSAT).
Aims of Aeolus and realised applications
Aeolus’ payload is the world’s first functioning space-based Doppler wind lidar and Europe’s first space-based lidar. The aim of the mission is to demonstrate this new technology in space for the benefit of weather forecasting and to improve the understanding of atmospheric dynamics, especially in the tropics, where both mass and wind information are required to constrain the analysis. Although the design life of Aeolus is three years, it completed four years in space on 22 August 2022.
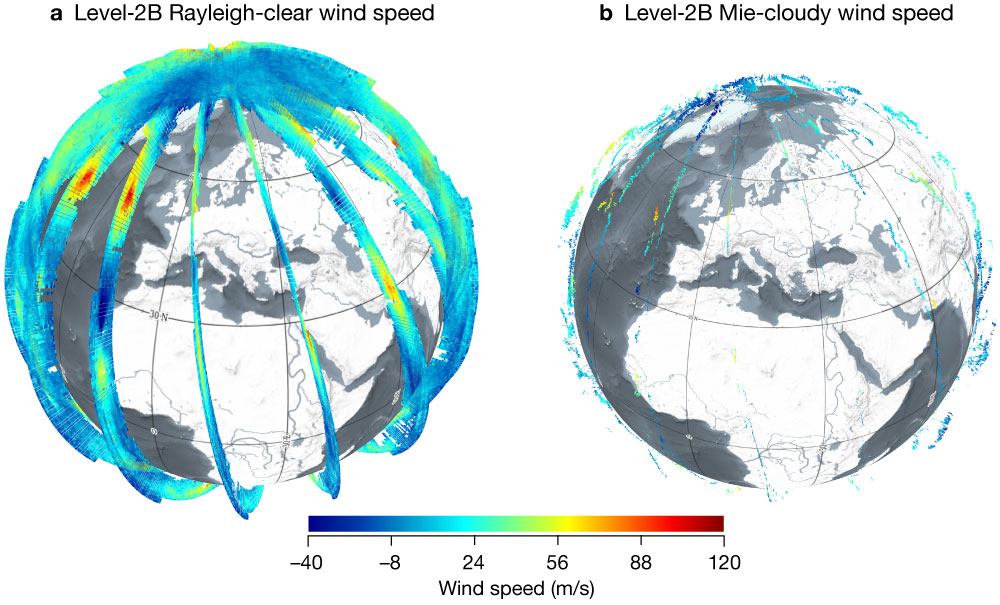
Aeolus orbital coverage and wind information in a 12‑hour period is shown in Figure 1. The near vertical ‘slices’ (tilted off-nadir by ~37 degrees) are the wind component information for 9 February 2020, which had near record-breaking jet stream winds over the Atlantic Ocean. Most of Aeolus wind coverage is from the Rayleigh-clear winds (backscatter signal from molecules in clear-air), but the Mie-cloudy (particulate backscatter from clouds and aerosol) have significantly smaller random errors and better horizontal resolution than the Rayleigh.
Aeolus winds have been proven to be of sufficient quality and coverage to significantly improve operational NWP forecasts, particularly in the tropics. They have been used operationally by NWP centres for over 2.5 years: pioneered by ECMWF, followed by Germany’s DWD (Deutscher Wetterdienst), Météo-France, the UK Met Office and India’s NCMRWF (National Centre for Medium Range Weather Forecasting). For details, see Rennie et al., 2021; Pourret et al., 2022; Laroche and St‐James, 2022.
When referring to Aeolus winds, we mean the Level‑2B processor wind retrievals, which are suitable for use in NWP and scientific research, due to several important extra processing steps relative to the Level‑1B data. ECMWF was able to benefit from the data quickly because of its strong involvement with the mission. It was, for example, part of the Mission Advisory Group and L2B processing algorithm development team before and after Aeolus was selected as an ESA Earth Explorer Mission in 1998. The L2B winds are processed as part of the ground segment at ECMWF, and the products are forwarded to ESA and EUMETSAT for distribution around the world.
ECMWF has been strongly collaborating with its ESA Aeolus Data Innovation and Science Cluster (DISC) partners. These include the German Aerospace Centre (DLR), the software company DoRIT, the Royal Netherlands Meteorological Institute (KNMI), and Météo-France. The DISC has run a quick development cycle on the ground processing software, allowing the data to reach a level of maturity suitable for operational assimilation after 16 months. Meanwhile, the processing algorithms have continued to improve through 15 revisions so far.
Aeolus has important uses beyond NWP. In particular, atmospheric dynamics research has benefited from Aeolus winds to study gravity waves, equatorial waves, sudden stratospheric warming events and quasibiennial oscillation monitoring, as highlighted at the third anniversary conference (https://www.aeolus3years.org/detailed-agenda). Aeolus winds are also proving useful to verify and hence improve other satellite-based wind observation types, such as atmospheric motion vectors.
As the first ever high-spectral resolution lidar in space, Aeolus also provides UV (ultraviolet) optical properties. These are being used in atmospheric composition research, for example on wildfire smoke, Saharan dust, volcanic eruption plumes and atmospheric composition data assimilation (see Box A). They are also being used for cloud research. The unique ability of a Doppler wind lidar to measure dynamics and optical properties should be exploited further in the future – for coupled atmospheric composition, cloud and dynamics forecasts.
A
ECMWF’s aerosol research activities using Aeolus
In addition to horizontal line-of-sight (HLOS) wind, the backscatter and extinction coefficients from hydrometeors and aerosols can also be retrieved from Aeolus measurements. As part of the Aeolus DISC activities at ECMWF, we assimilate the particle backscatter coefficient in research experiments using the IFS in atmospheric composition mode. This is done in a parallel setup to the one used operationally by the EU-funded Copernicus Atmosphere Monitoring Service (CAMS) run by ECMWF. This work began in late 2021, as a follow-up to previous work by Julie Letertre-Danczak and others. It aims to fully exploit the particle backscatter product of Aeolus and assess its impact on atmospheric composition forecasting.
The Aeolus L2A particle backscatter product has been included in monitoring experiments since the beginning of 2022, augmenting aerosol optical depth (AOD) measurements in the assimilation, which provide the total aerosol extinction in an atmospheric column, but no vertical profiling. The particle backscatter coefficient is assimilated on top of the operational CAMS configuration, and we are assessing the impact of this additional information on constraining the vertical distribution of aerosols in an atmospheric column.
ECMWF is also evaluating the impact of the assimilation of Aeolus particle backscatter on short-range AOD forecasts, e.g. to improve the AOD forecast from Saharan dust events. We compare our results with the operational CAMS forecast and validate with ground-based AERONET AOD measurements. Further to this, we compare the results with ground-based lidar measurements of particle backscatter and attempt to understand the bias present in the Aeolus particle backscatter.
Reprocessed data and impact experiments
Reprocessing, which refers to the processing of satellite data using a single state-of‑the‑art processing chain, provides a consistent dataset with superior quality compared to near-real-time data.
Aeolus has two fully redundant laser transmitters, referred to as flight models A and B. Aeolus started with flight model A, but due to decreasing laser pulse energy a decision was made to switch to flight model B in mid-2019. This led to some natural boundaries for the choice of which periods to reprocess.
DISC and ESA planned four reprocessing campaigns. Two campaigns covering the early flight model B period (June 2019 – December 2019 and then June 2019 – October 2020) have already been accomplished, and one covering the early flight model A period (September 2018 – June 2019) is being carried out. The fourth reprocessing is intended to cover the whole mission and is planned for 2023–2024. The first and second sets of reprocessed data significantly improved the quality (particularly systematic errors) with respect to near real-time data, as assessed by ECMWF.
We are currently investigating the NWP impact of the Aeolus L2B winds from the second reprocessing, using both observing system experiments (OSE) and the Forecast Sensitivity to Observation Impact approach. These experiments represent the longest ever OSE assessment for Aeolus. The results are also being compared with a near-real-time data OSE covering late 2021 and 2022, to assess how Aeolus impact has changed.
Trends in Aeolus data quality
Despite the improvement of the ground processing chain over time, the instrument’s spectrometer measurements have been getting noisier since mid-2019. This has been confirmed by ESA and DISC to result from a gradual reduction in the signal emitted by the Doppler wind lidar. The cause is likely due to so-called laser-induced contamination, reducing transmission through the instrument’s optics.
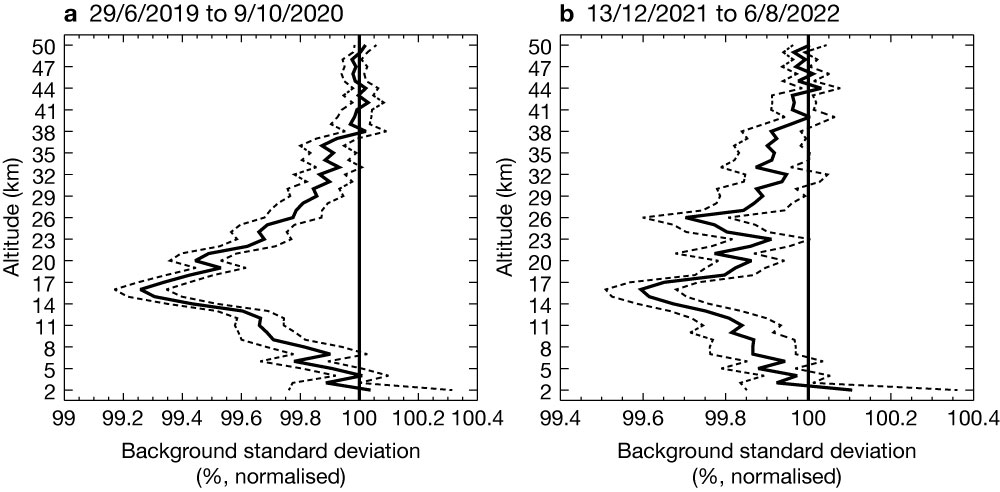
The declining signal is evident in the statistics of Rayleigh-clear random error estimates for the second reprocessed dataset, shown in Figure 2a. This has been restricted to the tropics to reduce solar background noise effects. It shows that the estimated one standard deviation of error (as estimated from departures from ECMWF short-range ‘background’ forecasts) increased by 40% by October 2020 compared to July 2019 (and by 60% by mid‑2022, not shown). The step in the random error estimate around early November 2019 was due to an experiment involving thinner vertical range-bins aimed at maximising collocations with atmospheric motion vector retrievals (part of calibration and validation efforts).
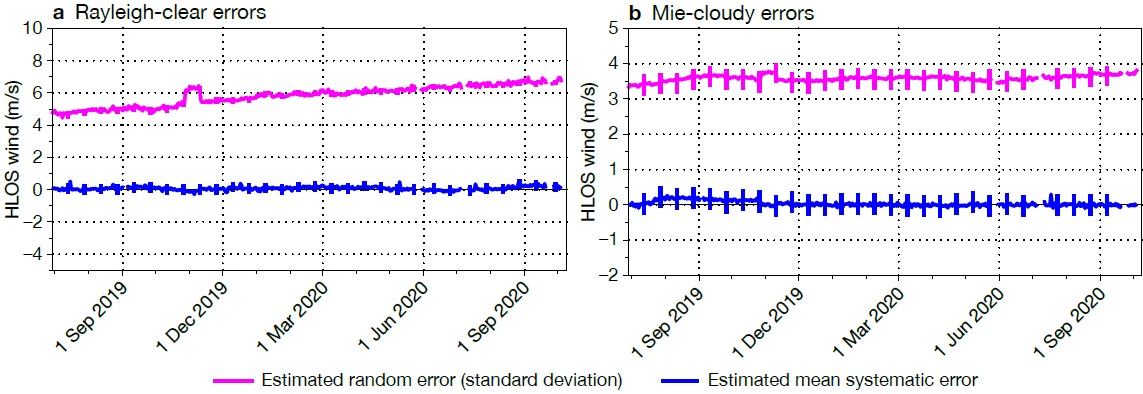
The best atmospheric path signal levels for the mission occurred just after the switch to flight model B laser in July 2019. A stronger signal, which implies higher photon counts, results in smaller random errors for the Rayleigh-clear winds. DISC-DLR monitoring and analysis show that the atmospheric path signal in mid‑2022 is only 30% of its July 2019 peak. Observation random errors, which have varied with time but are in the range 4–8 m/s for Rayleigh-clear winds, are larger than the background forecast random errors, which are typically 2 m/s in HLOS space. Therefore, improving the observation random errors translates to improved NWP impact through data assimilation.
The Mie-cloudy L2B HLOS wind random errors (Figure 2b) are less sensitive to the strength of the emitted signal. This is because the Mie backscatter from particles of ice/water in the clouds is sufficiently strong, whereas the Rayleigh scattering from clear-air molecules is relatively small. However, the number of Mie winds passing quality control checks slightly declines with time, as borderline low signal aerosol backscatter scenes are discarded.
Benefits to forecasts
The impact of Aeolus winds from the second reprocessing on forecast error is highlighted in Figure 3. It is shown along with the near-real-time dataset OSE covering 13 December 2021 to 6 August 2022 for comparison. This shows how Aeolus, with its best signal levels and best processing algorithms, improves the wind forecast by 0.5–2%, with a decent impact maintained into the medium range. The impact on temperature and humidity has similar patterns (not shown). Even the northern hemisphere extratropics geopotential at 500 hPa (~5 km) is improved up to day 4 by ~0.5–1% (not shown). This is despite the widespread presence of high-quality conventional data (radiosondes, aircraft). The largest impact occurs at ~100 hPa in the tropics, particularly the east Pacific Ocean (Figure 4).
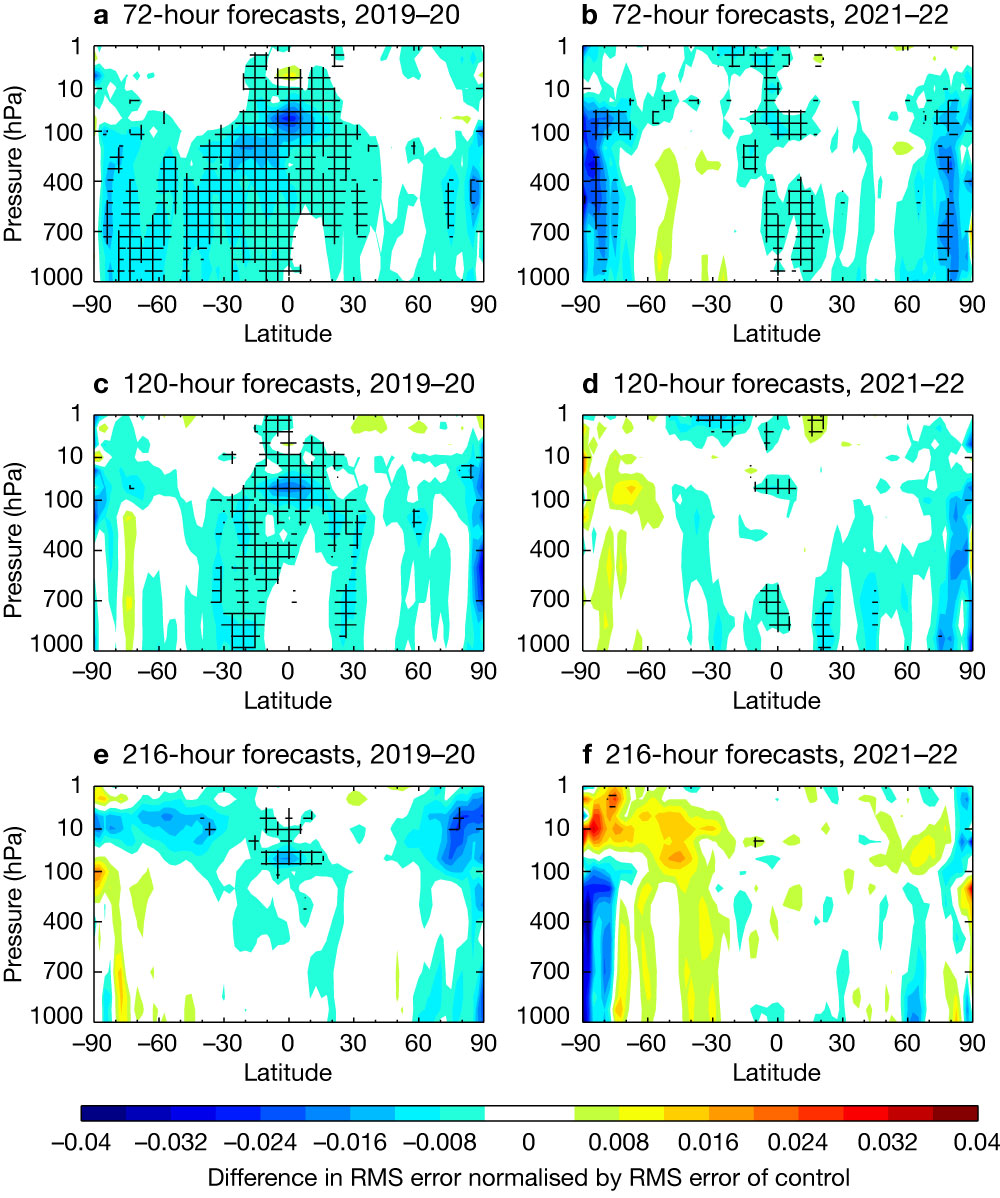
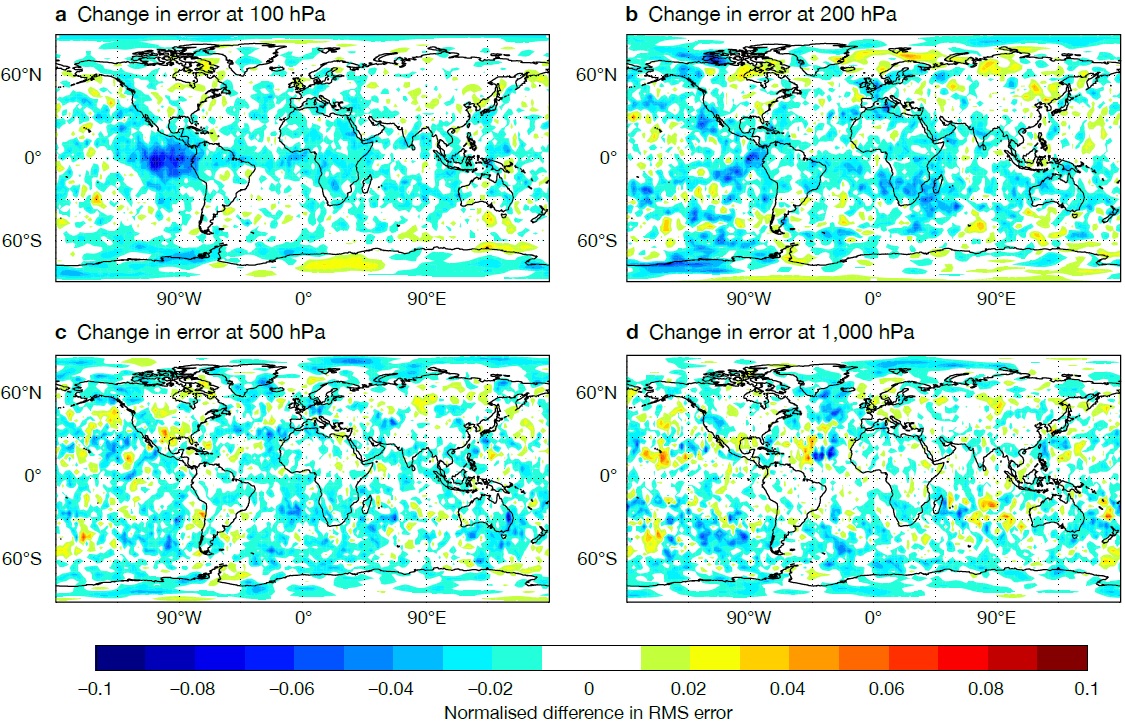
This is partly because the tropics have a relatively poor coverage from high-quality radiosonde wind profiles. The wind field in the tropics is also less constrained by temperature information from other satellites. Zonal wind analyses from NWP centres disagree the most at 100 hPa in the tropical east Pacific, an area where Aeolus is making the largest improvements.
Despite the significant impact reduction in 2022 due to increasing Rayleigh-clear noise, particularly in the tropics, there is still a decent positive impact near the poles. It was noticed that the magnitude of the impact reduces as the second reprocessing OSE length was increased, again due to the Rayleigh-clear winds becoming noisier with time.
Due to uncertainty in the verification at short forecast ranges when using the analysis as the truth, it is useful to assess the background forecast fit to other observations, with and without Aeolus. Indeed, the forecast fit to nearly all observation types sensitive to wind, temperature and humidity is improved by assimilating Aeolus. However, the highest impact was found in the tropics, as exemplified using GNSS-RO (Figure 5). The peak short-range forecast impact is found at around 15 km altitude (~150 hPa); the impact was almost three times bigger in the reprocessed dataset than in OSE using near-real-time data in late 2021/2020.
There is an unusually enhanced positive impact for the 2022 period at around 26 km altitude, which is explained by the large sample of good quality Mie-cloudy winds that Aeolus captured from backscatter of the Hunga-Tonga eruption plume in January 2022 (Aeolus range-bins were raised to 30 km shortly after the eruption, see ECMWF Newsletter 171). The eruption plume apparently brought an unprecedented amount of water vapour to the stratosphere (Millán et al., 2022).
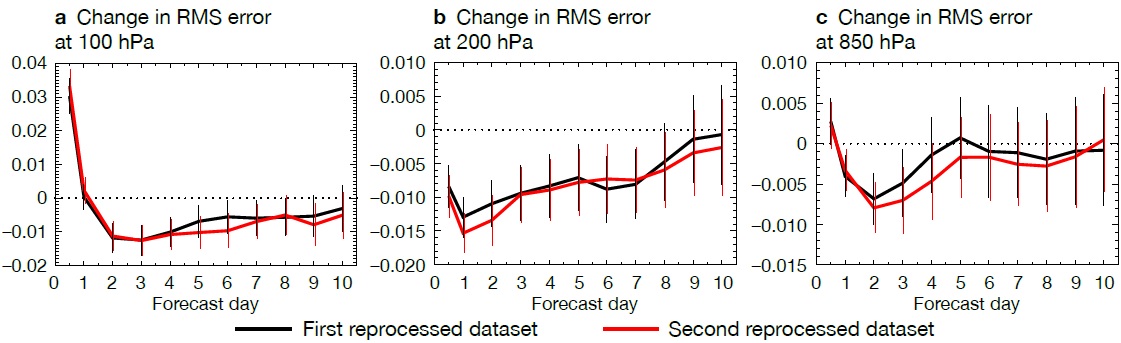
The second reprocessing improved the NWP impact relative to the first reprocessing campaign. This is true particularly in the lower tropical troposphere, as shown in Figure 6, thus justifying the effort on reprocessing. The improvement seems to result from more Mie-cloudy winds being available for assimilation.
The impact of observations on forecasts can be evaluated with respect to analyses using Forecast Sensitivity to Observation Impact (FSOI). The FSOI time-series for Aeolus shown in Figure 7 is derived from the reprocessed dataset until 9 January 2020, after which it uses the operational FSOI. It concurs with OSE findings that Aeolus impact peaked in the early flight model B period (August–September 2019) due to better data quality, when Aeolus provided ~5% of the relative FSOI. This was of a similar magnitude to some of the highest-performing satellite instruments of the time, such as IASI on EUMETSAT’s Metop satellites. Aeolus also has similar impact to the radiosonde network (not shown). The impact per observation is strong, too, coming second only to scatterometer winds among satellite-based observations.
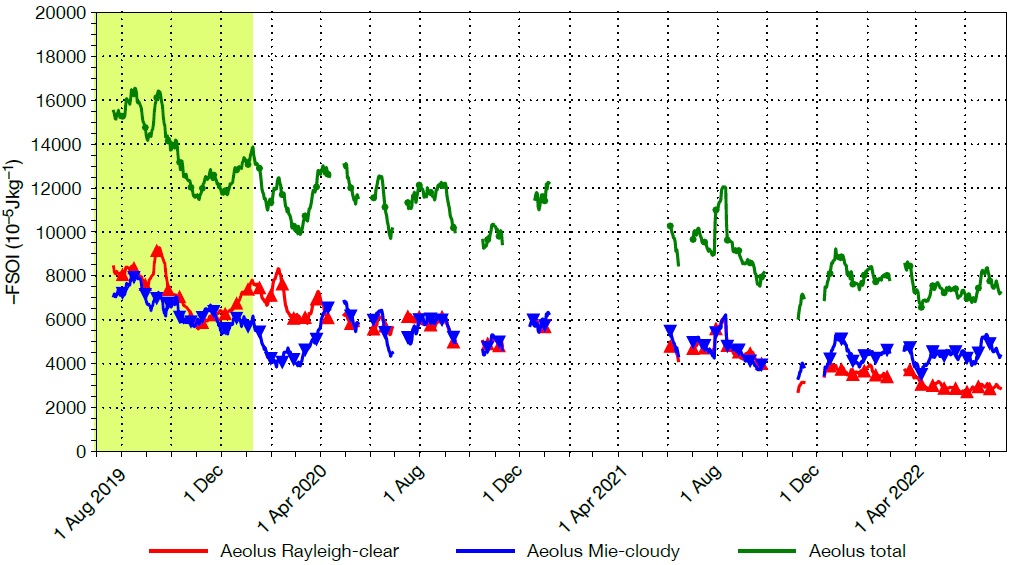
The strong impact from one instrument suggests that assimilating more wind profile information is indeed an efficient means of improving forecast skill. Note that Aeolus signal levels were a factor of two less than expected pre-launch, even at its best during the early flight model B period, leading to significantly noisier winds than expected. Therefore, if signal levels could reach Aeolus pre-launch expectations or even better in a follow-on mission, we can expect more NWP impact.
Conclusions and outlook
The longest Aeolus OSE performed at ECMWF, using the second reprocessed dataset, provides an assessment of short-to-medium-range forecast impact from Aeolus L2B winds. It gave the largest positive impact seen from Aeolus so far at ECMWF, with statistically significant and good magnitude positive impact on wind, temperature, geopotential and humidity forecasts in the tropical and polar troposphere and lower stratosphere. Root-mean-square error improved by 0.5–2% up to 3–4 days ahead. The positive impact extends to 9–10 days in the lower stratosphere (between about 100 and 50 hPa or 15 and 20 km) in the tropics and the southern hemisphere extratropics. The peak in tropical impact at 100 hPa occurs in the east Pacific – a region typified by large background forecast zonal wind errors. Recent near-real-time data OSE (late 2021/2022) show that Aeolus still provides some positive impact, but noticeably lower than that of the second reprocessed OSE. The reduction in impact is particularly strong in the tropics due to larger Rayleigh-clear wind noise, which in turn is due to the gradual weakening of the emitted signal.
Aeolus impact in the short forecast range, as measured by FSOI for the first and second reprocessing, shows that Aeolus was able to provide one of the best impacts for individual satellite instruments (up to 5% in July–October 2019), similar to the radiosonde network. Operational FSOI still shows positive impact in 2022, but at ~2% it is now less than half of what it was before.
The requirements of the proposed operational follow-on mission being considered by ESA and EUMETSAT exceed those of the Aeolus mission, therefore promising more positive impact.
ESA has plans to switch back to the flight model A laser late in 2022, with the hope of boosting the signal. This should also help to improve understanding of the transmission losses with flight model B and possibly improve the signal if the losses are restricted to the flight model B optical path. The Aeolus satellite is expected to be switched off and deorbited in the second half of 2023 due to the depletion of its fuel needed to maintain its rather low 320 km altitude orbit, especially with the current enhanced solar activity.
There is scope for further improvements in the Aeolus ground processing and assimilation algorithms, which should further improve NWP impact. This work will be pursued after satellite switch-off as part of the DISC. Such work would also benefit any operational Doppler wind lidar follow-on mission.
Further reading
Laroche, S. & J. St‐James, 2022: Impact of the Aeolus Level‐2B horizontal line‐of‐sight winds in the Environment and Climate Change Canada global forecast system. Quarterly Journal of the Royal Meteorological Society, 148(745), 2047–2062. https://doi.org/10.1002/qj.4300.
Millán, L., M.L. Santee, A. Lambert, N.J. Livesey, F. Werner, M.J. Schwartz et al., 2022: The Hunga Tonga-Hunga Ha’apai Hydration of the Stratosphere. Geophysical Research Letters, 49, e2022GL099381. https://doi.org/10.1029/2022GL099381.
Pourret, V., M. Šavli, J.F. Mahfouf, D. Raspaud, A. Doerenbecher, H. Bénichou et al., 2022: Operational assimilation of Aeolus winds in the Météo‐France global NWP model ARPEGE. Quarterly Journal of the Royal Meteorological Society. https://doi.org/10.1002/qj.4329.
Rennie, M.P., L. Isaksen, F. Weiler, J. de Kloe, T. Kanitz, & O. Reitebuch, 2021: The impact of Aeolus wind retrievals on ECMWF global weather forecasts. Quarterly Journal of the Royal Meteorological Society, 147(740), 3555–3586. https://doi.org/10.1002/qj.4142.