In September 2021, I began a 12-month World Meteorological Organization (WMO) Fellowship at ECMWF’s headquarters in Reading, UK. The aim of the fellowship was to develop an application for Africa within the Climate Data Store (CDS) team of the Copernicus Climate Change Service (C3S).
Soon after completing my PhD in atmospheric radiation at the University of Reading in 2012, I was recruited as a meteorologist at the National Department of Meteorology, Cameroon. In Cameroon, my main responsibility is to produce marine weather forecasts, but I also contribute to producing forecasts for other sectors. In addition, I carry out research on climate extremes and atmospheric radiation. Undertaking the WMO Fellowship at ECMWF was a unique opportunity for me to enhance my professional skills as well as to contribute to the development of weather and climate forecasting in Cameroon and Africa.
An agriculture application for Africa
During the fellowship, I developed an application in the CDS toolbox (cds.climate.copernicus.eu/cdsapp#!/toolbox) that supports agriculture in Africa. This was motivated by the fact that agriculture is a major economic activity in Africa. For example, in Cameroon it accounts for over 70% of the labour force and 40% of foreign earnings. Past and future information on climate variability and change is crucial for sustainable agriculture in Africa.
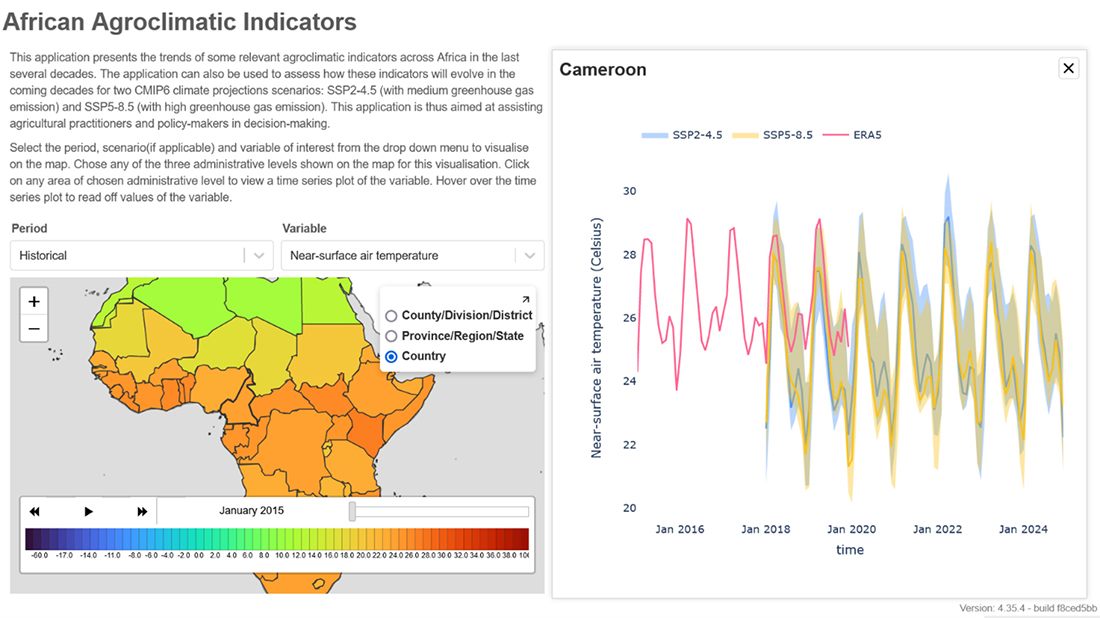
The application is called ‘African Agroclimatic Indicators’. It is based on ECMWF’s ERA5 climate reanalysis data and on climate projection data from the World Climate Research Programme’s Coupled Model Intercomparison Project Phase 6 (CMIP6). It is targeted at agro-industries that cultivate biennial and perennial crops. This application will provide long-term past and future climatic information required by these industries for their farming practices and crop yield projections. The application is also aimed at assisting policymakers in decision-making.
More precisely, the datasets used are:
- ERA5 monthly averaged data on single levels from 1959 to the present, and
- monthly averaged CMIP6 projections of 12 models at single levels and two Shared Socioeconomic Pathway (SSP) scenarios (medium and high greenhouse gas emissions), covering the period 2006–2100.
The indicators selected for this application are average 2‑metre temperature, total precipitation, soil moisture (upper level), evapotranspiration and 10‑metre wind.
These indicators, from both reanalysis (historical) and projection data, can be visualised on an active map of Africa averaged over three administrative levels: country, provincial/state-wide/regional and divisional/county/district levels. A time series of both the ERA5 and CMIP6 data for any of the indicators can be obtained by clicking on the chosen administrative level. The figure shows an example of these visualisations for a few selected years (the final application will include all the years stated above). The shading on the CMIP6 time series shows the percentile range of values in the projection data.
Other activities during the Fellowship
During this fellowship, I took the opportunity to further develop my professional knowledge and skills. In addition to studying some of ECMWF’s e‑learning courses (available at learning.ecmwf.int), I attended two ECMWF training courses (‘Use and Interpretation of ECMWF products’ and ‘A Hands-on Introduction to NWP models’), and the Using ECMWF’s Forecasts (UEF2022) event. Using the CDS toolbox to develop African Agroclimatic Indicators also helped to improve my Python programming skills.
Future work and recommendation
The African Agroclimatic Indicators application is in its final stages of development and will be made available to the public on the CDS in the next few months.
As discussed above, this application was developed for the agro-industries that specialise in biennial and perennial crops. It is equally important to develop another application using seasonal forecasts for annual crop farming (which is practiced by small-scale or subsistence farmers as well as by some industrial farmers).
The CDS toolbox, which has wrappers in Python, is a very powerful tool for downloading climate data and developing applications based on these data. With basic knowledge of Python programming at the start of my fellowship, I found that it was a steep learning curve to get to grips with the toolbox. At the moment, it would appear that the toolbox can only be effectively used by advanced Python programmers. In the future, I would recommend that the toolbox is re-developed to make it more of a direct Python and interactive interface (e.g. in Jupyter notebooks or a similar environment). This interactive mode will undoubtedly assist users with less advanced Python programming skills to gain confidence in using even the more advanced features of the CDS toolbox.
Work is under way in the CDS team at ECMWF to re-develop the CDS toolbox to make it more user accessible. I believe my experiences during the fellowship have been very useful to demonstrate the development required.
More information on the WMO Fellowship scheme can be found here: https://www.ecmwf.int/en/learning/training/wmo-fellowship-scheme.