
Since 2021, ECMWF has been running an internal project (UGROW) that focuses on understanding systematic error growth in the Integrated Forecasting System (IFS) from hours to seasons ahead. Characterising the dominant forecast errors that currently limit predictive skill is the first step towards model improvement. Three subtopics were selected: a bias in the winter North Pacific jet stream; a bias in northern hemisphere summer tropospheric temperature; and Indian Ocean surface biases. Below we offer a summary of the main findings. More details can be found in ECMWF Technical Memoranda No. 889, 891 and 898 (https://www.ecmwf.int/en/publications/technical-memoranda).
Bias in the North Pacific subtropical jet
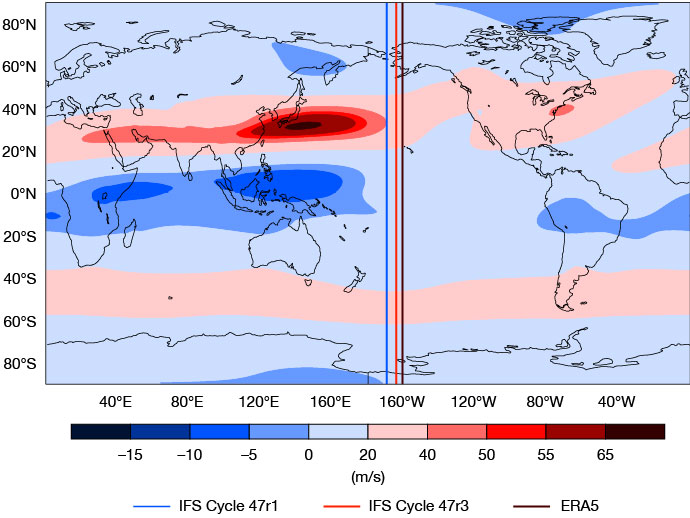
The eastern edge of the subtropical jet in the North Pacific moves westward with lead time in extended-range forecasts (weeks 1 to 4), as illustrated in the first figure for IFS Cycle 47r1. This error is present in most sub-seasonal to seasonal (S2S) models, and it is thought to affect the representation of teleconnections originating from the Madden–Julian Oscillation (MJO). The bias increases with lead time up to week 4, and it exhibits a strong seasonality, being strongest in January.
This bias in the extended-range forecasts seems to be linked to errors at day 1 over the Sea of Japan. It is significantly larger in the control ensemble forecast than in the perturbed ensemble extended-range forecasts. This difference is due to the impact of the stochastic physics scheme in the tropics, which heats the lower latitudes and decreases the thermal wind. A series of sensitivity experiments, where part of the atmospheric circulation is nudged towards ERA5, suggests that there is not a unique source for this bias. However, model errors in the high latitudes seem to be a major contributor. The bias has been considerably reduced in IFS Cycle 47r3, which became operational in October 2021.
Bias in the Eastern Indian Ocean
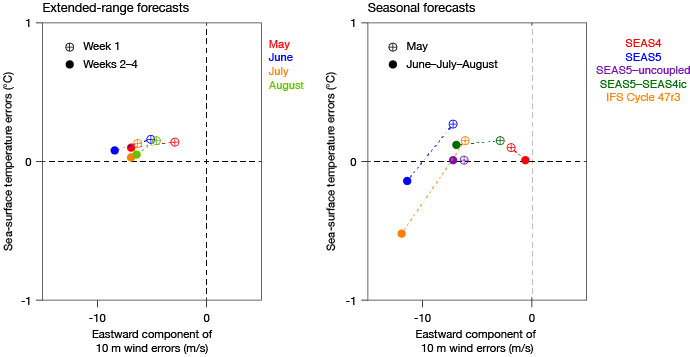
Operational seasonal forecasts (SEAS5) exhibit a cold sea-surface temperature (SST) bias and an easterly wind bias over the Equatorial Eastern Indian Ocean, which is most pronounced over boreal summer and autumn. This region, the eastern node of the Indian Dipole Index, plays an important role in intraseasonal and interannual variability. It interacts with El Niño and is a key region for tropical-extratropical teleconnections.
The error first manifests as an easterly wind bias, which is already visible at week 1 (see the figure for extended-range forecasts). In SEAS5 this bias amplifies with time via coupled feedbacks and eventually manifests itself in SST (see the figure for seasonal forecasts). Note that in the previous seasonal forecast system (SEAS4) the coupled feedback acted to reduce this error. We have studied the dependency of this error on ocean and atmosphere initial conditions, ocean and atmospheric resolution, and different model cycles. We conclude that there are two fundamental and independent sources of errors. The first one is atmospheric in nature and is largely related to an overly strong and stable trade wind circulation. This easterly wind bias has not improved in recent model cycles (see for instance the increased biases in IFS Cycle 47r3 shown in the figure). The second error is of oceanic origin, associated with the depth of the thermocline: a shallow (deep) thermocline in SEAS5 (SEAS4) will enhance (dampen) the SST errors arising from errors in the wind. Both ocean initial conditions and the ocean model contribute to the amplification of wind errors at seasonal timescales.
Warm temperature bias
In this subtopic of the UGROW project, we have investigated the warm bias in the lower to mid-tropospheric atmosphere during northern hemisphere summers. The bias was investigated across different time scales and with a range of diagnostic tools. The warm bias peaks at around 700 hPa and mainly grows over land masses in the first days of the forecast. While it is present over most of the northern hemisphere, it has a maximum over eastern Asia in early forecast ranges, and it is spreading to the northern Pacific later. Despite being robust both in terms of day-to-day and year-to-year variability, the investigations so far have not pointed to a clear model error source, and we cannot rule out the idea that the bias is a combination of several sources.
Summary and outlook
The errors in the three different UGROW subtopics have different characteristics: i) non-local propagating errors in the eastern edge of the subtropical jet, peaking at 2–4 weeks into the forecast, but hardly detectable in the first few days; ii) a flow-dependent error amplified by coupled processes in the Eastern Indian Ocean, which first appears as an easterly surface wind bias in the first forecast week and subsequently amplifies into strong SST errors at seasonal timescales; and iii) a robust fast local error growth peaking in the first forecast days which results in a pronounced warm summer temperature bias around 700 hPa. The different characteristics of error growth have obvious implications for the evaluation of model developments for a seamless forecasting system, in that the performance of the model at the medium range is not a trivial indicator of the performance at longer lead times.
There are plans to continue monitoring these errors in future model developments. The diagnostics developed in the first year of UGROW will be applied to upcoming system developments and model cycles. For 2022, we are continuing the cross-departmental collaboration with UGROW-Trend, which targets the ability of the forecasts to capture the observed long-term trends in surface variables and tropical cyclones at different lead times. The fidelity of model trends is particularly relevant for model developments targeting reanalyses, and it will affect skill at the extended and seasonal range. It will provide additional evaluating metrics to benchmark Earth system model developments.