
Over the weekend of 11 and 12 June 2022, ECMWF welcomed 37 participants to its headquarters in Reading to take part in Hackathon 2022: Visualising Meteorological Data (#VisMetData). Following on from UEF2022, which had the same theme, the aim of Hackathon 2022 was to further explore how weather and climate data can be visualised to be more useable, understandable and impactful for users and the broader public.
Not your usual hackathon
While most hackathons aim primarily to attract coders and computer programmers, Hackathon 2022 was different. It looked to gather not just coders but designers, data wranglers, meteorologists, storytellers, journalists – anyone with an interest in meteorological data and visualisation – to work on a variety of challenges. Indeed, we were fortunate to welcome participants from a great range of diversity and backgrounds.
Three challenges were proposed as part of Hackathon 2022: visualising data (#VisData); telling stories with data (#StorytellingData); and data processing (#101MemberEnsemble). There was also an open challenge (#OpenHack). Within each challenge, projects were proposed by ECMWF staff for participants to work on or to help inspire their projects. A lot of data was also made available to attendees in addition to all the open data currently available from ECMWF.
And so the weekend begins …
Excited participants and ECMWF volunteers began arriving early on Saturday morning. The event began and, as the lead organiser, I explained why the theme of Visualising Meteorological Data is so important and how the weekend would work.
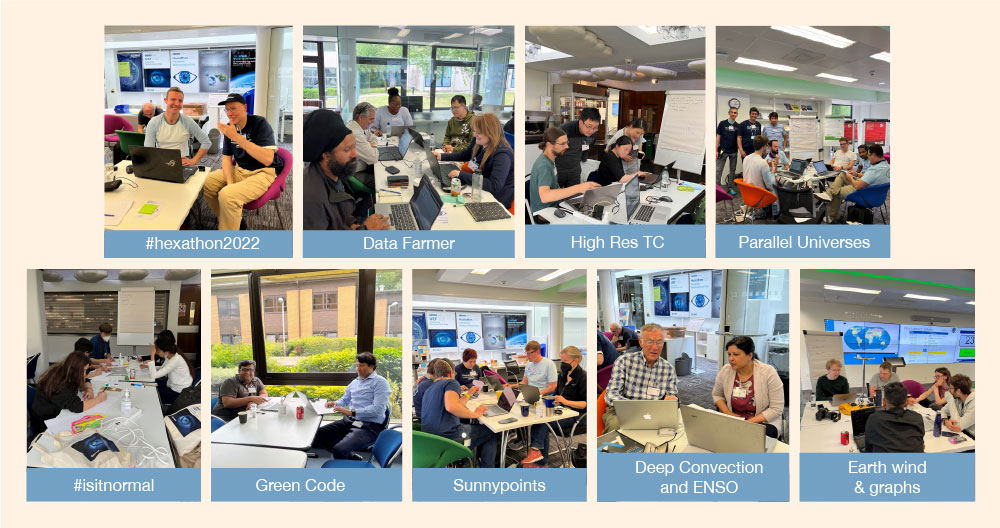
ECMWF volunteers then presented their project ideas under each challenge. After coffee and much networking and idea development, participants pitched their ideas and put together teams to work on them. Nine teams were established, working across all challenges on a variety of projects. All participants were thrilled to be given a supercomputer hall tour by ECMWF’s Director of Computing, Martin Palkoviç, who also got a lot of questions!
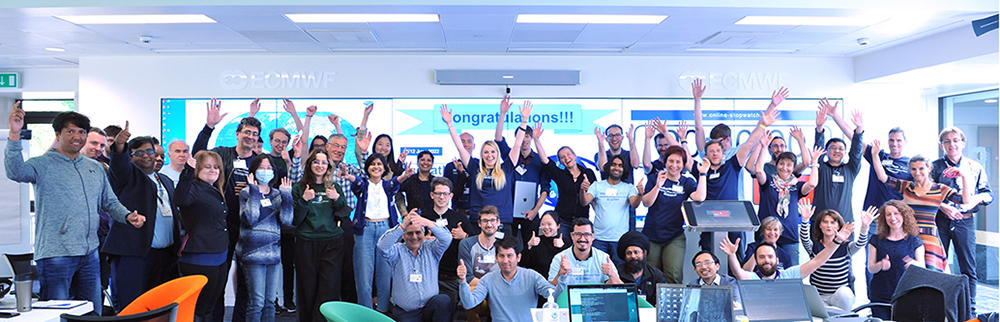
At 2 pm, teams and volunteers assembled in the Weather Room for the countdown to the 24-hour hackathon. As the clock started, work immediately began with a flurry of typing and a buzz of discussion. Volunteers assisted teams with data access and processing and project ideas throughout. Many participants and some volunteers got very little sleep, working late into the night and starting early Sunday morning. Just before 2 pm on Sunday, excited tension built up in the Weather Room as teams frantically tried to finish their work. A 10‑second countdown finished the hackathon followed by an outburst of clapping and cheers and group photos.
Show & Tell time
An esteemed panel of judges were invited to judge the nine projects: Liz Bentley, President of the Royal Meteorological Society (UK); Scott Duncan, meteorologist and well-known designer of weather and climate graphics on Twitter; Elín Björk Jónasdóttir, Head of Forecasting at the Icelandic Meteorological Office; Rachel Warner, a lecturer of typography and graphic communication from the University of Reading (UK); and our very own Florence Rabier, Director-General of ECMWF.
Each team had 10 minutes to present their project and what they had done. This was followed by two minutes for questions from the judges. Each project was evaluated based on four criteria: originality, impact, impressiveness and use of data. The judges were astonished by the quality and variety of work which was done in just 24 hours. Audible ‘wows’ could be heard during team High Res TC’s visualisation of 1 km data showing tropical cyclone development, and everyone got hungry when team Parallel Universes named each visualisation after food with lasagne, tomato and bolognaise plots, to name just a few. After much discussion, the judges chose team #isitnormal as the winners of Hackathon 2022. The team were awarded with certificates, data visualisation books and gift vouchers during the prize-giving ceremony.
Hackathon 2022 ended with cake and tired satisfaction looking back at a fun and enjoyable event. Feedback has been overwhelming: “Quite simply the best example of a hackathon or sprint challenge that I have encountered – by a wide margin”, “I had a wonderful time … thank you for organising” and “Thank you so much for organising such a great event”.
The Show & Tell presentations from each of the projects were recorded and are now available on the Hackathon 2022 events page (https://events.ecmwf.int/event/305/) along with other information about the event and each project.
Winners of Hackathon 2022
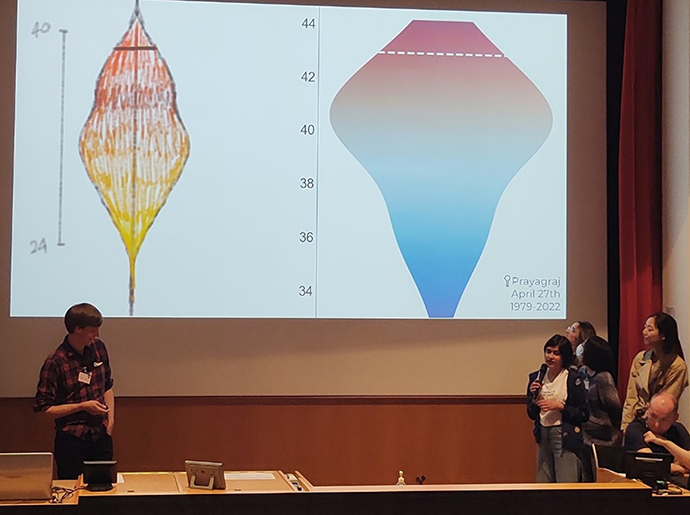
Team #isitnormal with members Lisa Lam, Emiliana Myftari, Athulya Saiprakash, Thomas Turnbull, and Elizabeth Zhu were the winners of Hackathon 2022. Their project focused on the question “How does today’s weather compare to the historical normal?” and targeted a general audience. They used data from ECMWF’s ERA5 reanalysis and focused on temperature. They used the Climate Stripes as inspiration to plot clickable historical monthly temperature time series and innovative violin plots to showcase today’s temperature compared to historical values and averages for different cities across the world. The team also created a map function to demonstrate changes of temperature across regions and locally.