During the period March, April and May (MAM) 2022, Pakistan and northwest India experienced temperatures much above normal. All weeks starting between 7 March and 9 May had a strong warm anomaly. The prevailing hot conditions also led to worse-than-normal air quality due to ongoing fires, and drought conditions hampered food production.
An exceptional heatwave
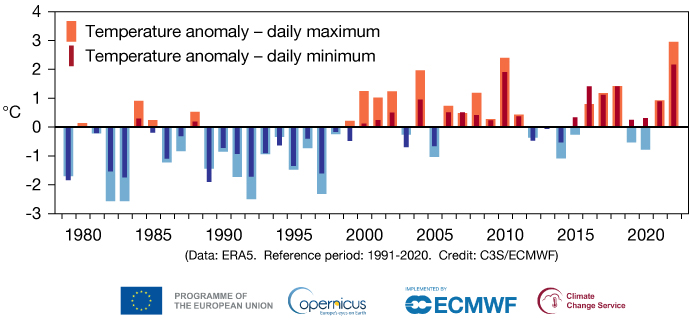
To evaluate the heatwave from a climatological perspective, we use the 2-metre temperature product from the ERA5 reanalysis. The product is based on land-data assimilation in ERA5, which assimilates 2-metre temperature observations. For data dense regions, it typically means that the product is close to the observed values despite the background forecast having a cold bias for hot periods. Here we consider the land area in the region 20°N–37°N and 61°E–78°E, which includes not only northwest India and virtually all of Pakistan, but also most of Afghanistan and small parts of neighbouring countries. For this area, MAM 2022 was the hottest in the ERA5 record in terms of daily maximum and minimum temperature, though by a larger margin for maximum temperature than for minimum temperature (see the temperature anomaly time series). These results are consistent with the monthly climate reports based on averages of station observations issued by the India Meteorological Department and the Pakistan Meteorological Department.
The UTCI heat stress index
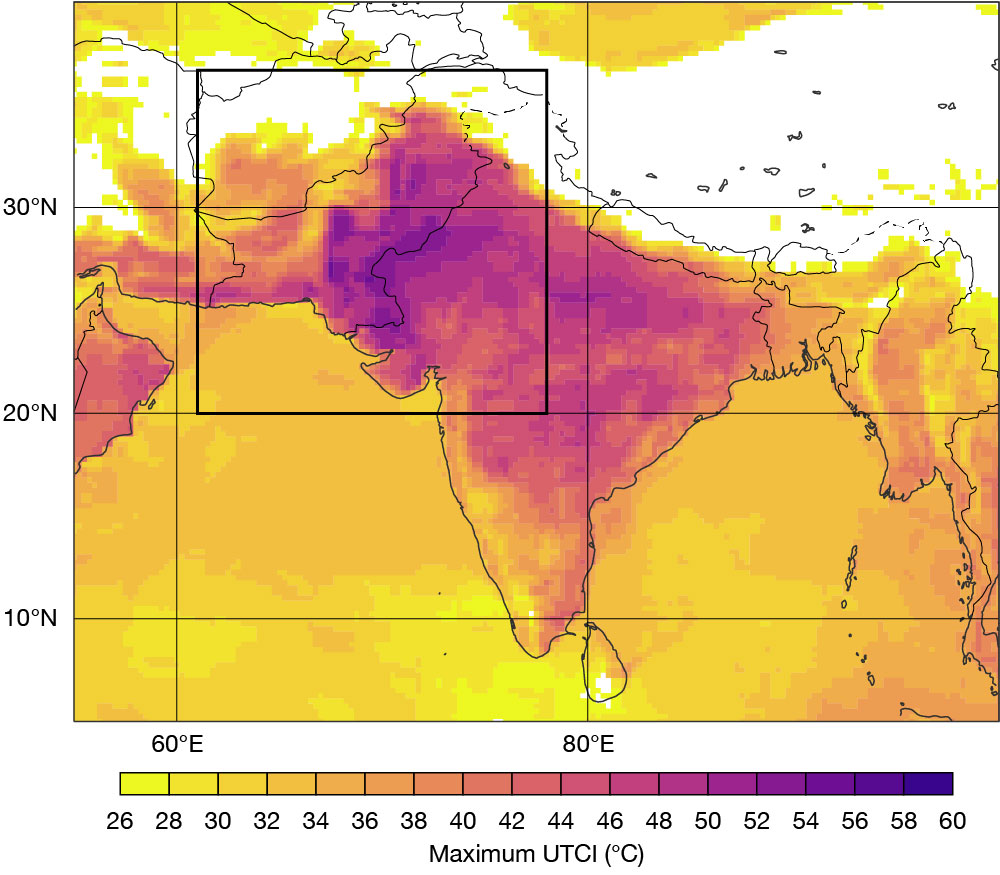
While extreme temperatures are often the focus, other factors are important in understanding the impact of heatwaves on health. A comprehensive and widely used heat stress index is the Universal Thermal Climate Index (UTCI), which is computed using ERA5. The UTCI is available through the data store of the EU-funded Copernicus Climate Change Service operated by ECMWF.
It is a biometeorological index that takes into account temperature, dewpoint temperature (and therefore humidity), wind speed, and the incidence of thermal and solar radiation on a reference individual (known as the mean radiant temperature), alongside modelling how the human body responds to different thermal environments.
UTCI is given in °C as an indication of a ‘feels-like temperature’. When UTCI exceeds 26°C, there is moderate heat stress, and values exceeding 46°C indicate extreme heat stress. At that point it is imperative to cool down immediately and take action to avoid heat stroke. The maximum heat stress map shows a map of the maximum UTCI from ERA5 on 14 May 2022 at the peak of the heatwave, which saw UTCI values of up to 55°C. This exceeds the average maximum UTCI (based on a climatology from May 1991–2020) for the time of year by up to 10°C in central Pakistan and up to 6°C in northern India.
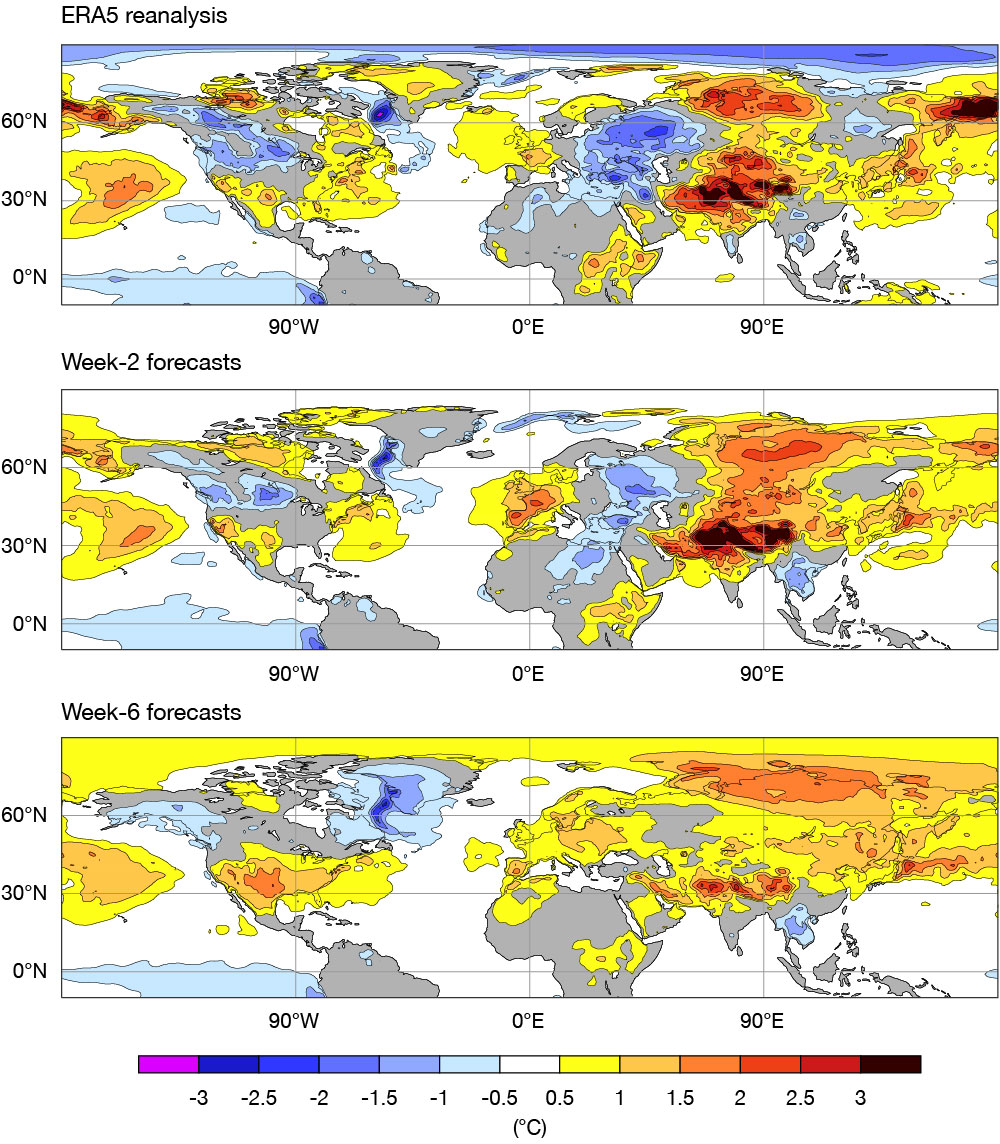
The heatwave’s predictability
How well predicted was the warm anomaly during MAM in extended-range forecasts? To answer this question, the third figure shows the mean anomaly for the period 28 February to 29 May 2022 from ERA5, and composites of ECMWF extended-range week‑2 and week‑6 forecasts with the same valid time. For ERA5, the warm anomaly over the affected region is very clear as expected. The warm anomaly was also well predicted in the mean from all week‑2 forecasts, together with other anomalies around the northern hemisphere.
Albeit with lower amplitude, a warm anomaly is also present over Pakistan and northern India in the mean from the week-6 forecasts, indicating a high predictability for the heatwave. However, the same cannot be said for other anomalies around the northern hemisphere. For example, the predicted warm anomalies over eastern Europe, eastern Asia and the Arctic verified with the opposite sign. This raises the question about the mechanism behind the prediction of the India/Pakistan heatwave on this timescale. If the predictability was due to a quasi-stationary extra-tropical Rossby wave, one would have expected the other nodes to be captured as well. But it is also possible that the forecast anomaly bears the imprint of more long-lived predictability drivers and an imprint of the climate trend over the 20-year re‑forecast period. The amplitude of the trends in the re‑forecasts at different lead times is currently under investigation in the internal ECMWF project UGROW-Trend.