This year’s Using ECMWF’s Forecasts event (UEF2022), after two years of being fully virtual, welcomed over 40 in‑person attendees to ECMWF’s headquarters in Reading between 7 and 10 June, with up to 85 participating online at any one time. UEF2022 had a record number of registrations, with 450 people registering from 83 countries.
The aim of UEF events is to exchange ideas and experiences on the use of ECMWF data and products. This year’s theme of ‘Visualising Meteorological Data’ focused on four areas: presenting and visualising meteorological data; communicating forecast and climate data; technology to display and process meteorological data; and data visualisation and understanding in other fields. Several high-profile and inspiring speakers gave presentations on these issues.
Meeting highlights
Florian Pappenberger, Director of Forecasts at ECMWF, gave an update on the Bologna Our New Datacentre (BOND) timeline and showcased 4 km and 2.5 km storm- and eddy-resolving simulations, using ECMWF’s Integrated Forecasting System (IFS) on the Atos supercomputer in the nextGEMS project. ECMWF’s role in the EU’s Destination Earth initiative, which aims to develop a digital model of Earth, was also presented. David Richardson, Head of Evaluation at ECMWF, gave an overview of the most recent model upgrade to IFS Cycle 47r3. This included improved visibility, revised wind gusts and many new products and data fields as requested by Member States. Andy Brown, Director of Research at ECMWF, showed positive IFS scorecards for various model fields and provided plans for future upgrades. Presentations also highlighted the vast array of open data and products available, including OpenCharts and its Jupyter Notebook integration.
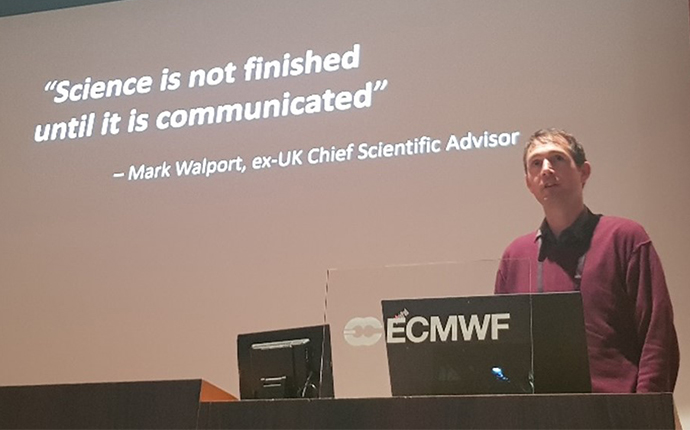
The theme of visualising meteorological data dominated many of the presentations. Ed Hawkins (University of Reading, UK), the creator of the Climate Stripes (#ShowYourStripes), gave an inspiring presentation on the importance of good graphics in science communication. He provided examples of different ways to visualise data and convey messages, including the importance of appropriate colour palettes. Ed discussed how the Climate Stripes ‘break the rules’ of design as they include no numbers or text. However, they do start a conversation and open a door to talking about climate change.
Tim Hewson (ECMWF) presented the ‘User Requirements Matrix’, a fascinating way to determine what visualisations of forecast data need to include based on the target audience. He also gave many tips and recommendations for visualising meteorological data.
Marie Boisserie (Météo-France) presented a new tool, called the automated surveillance system, which provides weather warnings based on thresholds. Guy Shalev (Google) gave an overview of their Flood Forecasting Initiative, which uses a machine-learning-based hydrological model and communicates emergency messages to users.
Josh Dorrington (Karlsruhe Institute of Technology, Germany) highlighted the need to add narratives to forecasts to translate science into impacts and useable products.
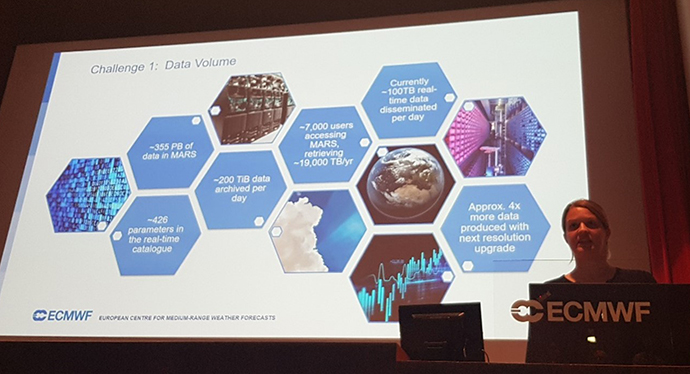
Emma Pidduck (ECMWF) gave a special talk on ‘The Open Data Pathway’. She presented the challenges of ECMWF moving to open data, which includes changes to data volumes and data revenue.
User survey results
Two sets of survey results were presented at UEF2022. The first was the outcomes of a user consultation for the SEAS6 upgrade to ECMWF’s long-range forecasting system, which will be made operational in 2024. The consultation asked users for their preferences for enhancements to the SEAS system, including more ensemble members, more initialisation dates, more re‑forecasts, and increased forecast range. Forty responses were received from a range of user backgrounds. The strongest support was for enhanced ensemble size and increased frequency of runs of the seasonal forecast.
The second was the User Voice Corner survey, which is sent annually to all registered UEF2022 participants. The aim of the survey is to gather feedback on ECMWF forecasts and forecast products. This year’s survey had 45 respondents, including 58% from national meteorological and hydrological services and 24% from private companies. Montenegro showed a notably good forecast of heavy rainfall at a lead time of three days, and Greece reported a ‘great forecast, days in advance’, for a snow and thundersnow event. On the other hand, Georgia highlighted issues with rainfall in spring/summer, and Croatia provided an example of a poor regime transition forecast. Participants were also asked about the next version of the IFS, Cycle 48r1, and for comment on the planned changes. Generally comments were supportive, but the increased data volumes are seen as a potential issue. In general, satisfaction with ECMWF forecasts and products is very high. The results of the survey will allow us to investigate issues seen by users to further improve the forecasts.
Interactive visualisation
Using what they had learned during UEF2022, participants were invited to provide feedback on the visualisation of ECMWF products. Fifteen posters were shown with various products on them, including the Extreme Forecast Index (EFI), tropical cyclone products, the Global Flood Awareness System (GloFAS) and seasonal forecasts. Attendees were invited to make comments on post-it notes about what could be improved and what they liked about the forecast visualisations. The session made UEF2022 participants think about ECMWF product visualisation, and ECMWF staff discussed their own products and how they could be improved in the future.
Feedback has suggested that the theme of UEF2022 has made participants really think about their visualisations and how they can be made to be more useful to users. Feedback received included “the presentations were directly useful and inspiring” and “the theme itself gave importance to users and applications of model data”. The aim is for the visualisation ideas and concepts to filter though to operational products in the near future. Other feedback comments thanked UEF2022 organisers for the event. The hybrid format was much appreciated and the quality of the speakers was positively commented on.
All talks and some posters can be accessed on the UEF2022 page: https://events.ecmwf.int/event/296/