
An accurate knowledge of the ocean has a profound impact on our ability to forecast the weather over a variety of timescales, from just a few days out to many months. Energy is constantly being exchanged between the atmosphere and the ocean, and our coupled model, which includes the ocean model NEMO (Nucleus for European Modelling of the Ocean) in the Integrated Forecasting System (IFS), aims to capture these highly complex interactions. The ocean surface is clearly critical as it is where these physical interactions take place. In particular, the sea-surface temperature (SST) needs to be determined extremely accurately to make successful forecasts. Here we describe a new way of determining SST from coupled data assimilation.
Motivation
For many years ECMWF and other numerical weather prediction (NWP) centres have imported externally generated products of SST. ECMWF previously used the Reynolds SST from the US National Oceanic and Atmospheric Administration (NOAA) and more recently the OSTIA SST from the UK Met Office. These 2D fields are produced by blending satellite information (mostly infrared) with in-situ ocean observations from ships and buoys. However, the production of such SST fields is an extremely challenging science problem. Firstly, assumptions must be made about how significantly the composition of the atmosphere (e.g. clouds, humidity and aerosol) has affected the satellite radiation measurements being used to estimate SST. This requires a highly accurate knowledge not only of the atmospheric state but also of the radiative impact of constituents such as humidity. Secondly, at times and/or locations when there are no observations at all (for example away from buoys and where clouds completely obscure the ocean surface), crude persistence assumptions must be made about how the ocean surface has changed since it was last viewed. Clearly, in dynamically evolving situations such as tropical cyclones, where the ocean surface may be changing rapidly and having a significant impact on the storm’s development, such assumptions could prove literally fatal.
These two challenges prompted research teams at ECMWF to investigate the possibility of estimating SST inside our coupled atmosphere–ocean data assimilation system. Information on the ocean surface could be extracted directly from a large network of satellite radiance measurements already present in the atmospheric 4D‑Var data assimilation system, where the most accurate up-to-date knowledge of atmospheric composition and its radiative impact is available. And when there are no observations available, the time evolution of SST in the data assimilation system is controlled by the coupled atmosphere–ocean model. This encapsulates our best knowledge of the physical factors that cause changes in the ocean surface (e.g. heat exchange, radiation, wave forced mixing etc.) and should be significantly more accurate than assuming persistence.
Outer-loop coupling between atmosphere and ocean
The prototype system currently being tested is based upon an approach known as outer-loop coupling. The atmospheric 4D-Var assimilates only atmospheric observations (satellites and in-situ data), while the ocean NEMOVAR data assimilation system assimilates only ocean observations (in‑situ and satellite altimeters). However, at each outer loop (update) a coupled atmosphere–ocean short-range forecast is run. In this way, any changes to the ocean (forced by the assimilation of ocean observations in NEMOVAR) propagate into the atmosphere. Likewise, any changes to the atmosphere (forced by the assimilation of observations in 4D-Var) propagate into the ocean. With this approach, an observation located in the atmosphere (e.g. a scatterometer wind speed measurement) can influence the ocean state and an ocean observation (e.g. an ARGO float measurement) can similarly influence the atmosphere during each analysis cycle.
The RADSST system
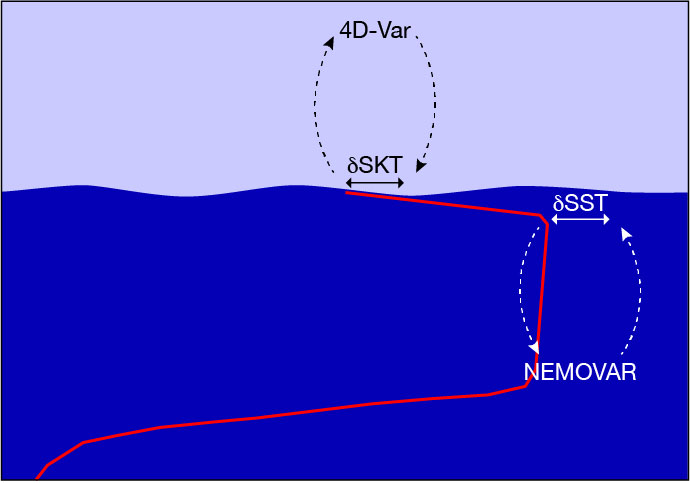
The new system that has been developed to estimate SST from satellite radiances is called RADSST. In this method, the outer-loop coupled data assimilation approach has been modified to additionally communicate information on the ocean surface from satellites in the atmospheric component of 4D‑Var to the ocean. Infrared sensors such as IASI and CrIS have many hundreds of channels which are acutely sensitive to radiation emitted from the top few microns of the ocean surface. As such these spaceborne infrared sensors can detect changes in what is usually termed the surface skin temperature of the ocean. Depending on the time of day and sea state, this surface skin temperature (SKT) can differ from the bulk SST of the water just below by up to one degree kelvin. A model parametrization of the so-called cool skin effect is used to estimate the former from the latter. In RADSST, an estimate of the bulk water SST from the top layer of the ocean is converted to SKT (using the coolskin parametrization) and provided to 4D-Var. A critical assumption in this process is that the model parametrization is correct as it is not yet possible to constrain this by observations. This means that we effectively attribute any mismatches between the parametrization and the values sensed by satellites in SKT to errors in the bulk water temperature from the ocean model (Figure 1).
Performance of RADSST
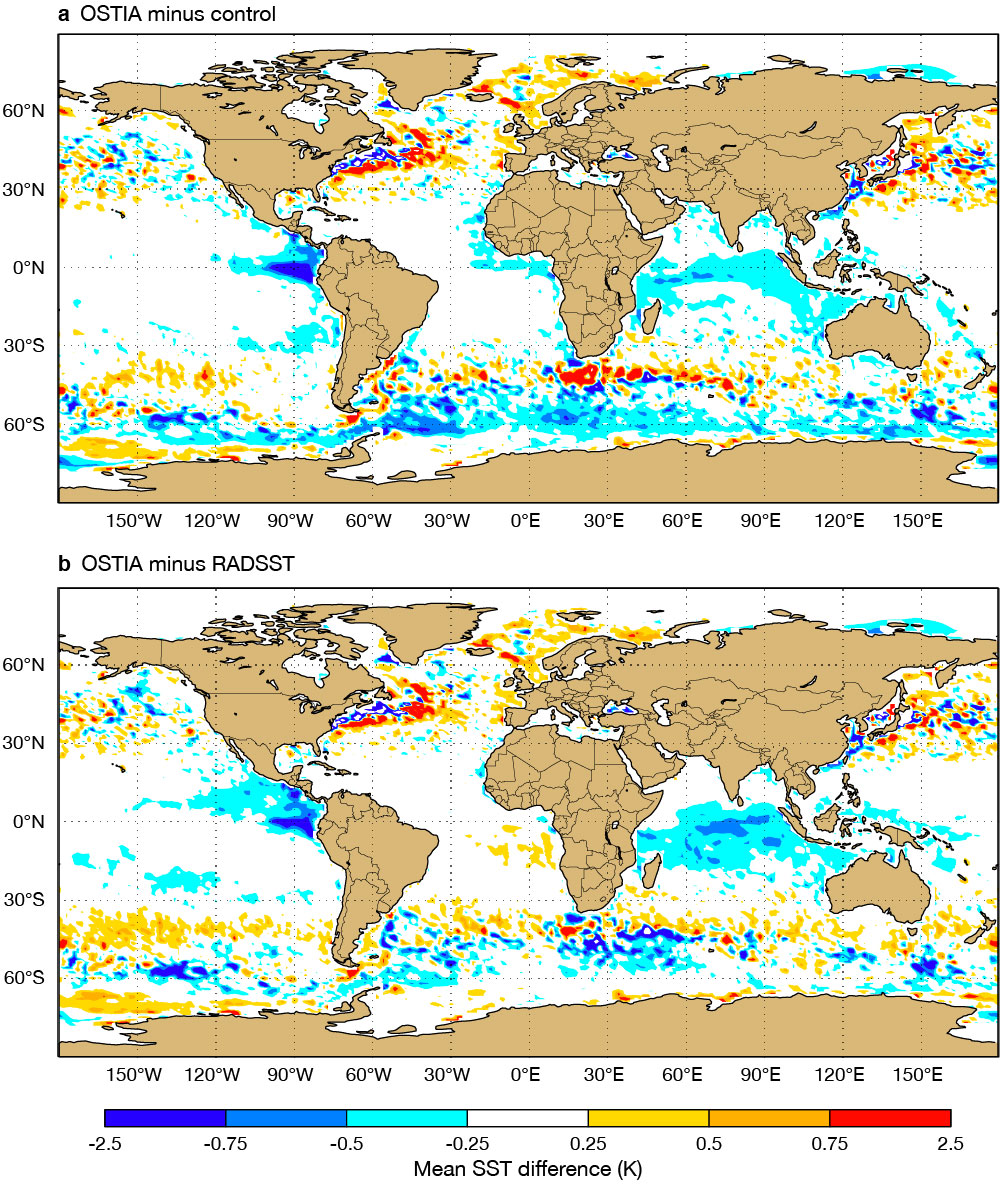
The prototype RADSST system has been run over two extended experimental periods to gain some preliminary insights into its performance. During the first period (June 2020), the system used IASI radiances from three satellites (Metop‑A, -B and -C), CrIS radiances from two satellites (NPP and NOAA-20) and AIRS radiances from the AQUA satellite. In a second and more recent period (January to March 2022), the Metop‑A satellite had been decommissioned by EUMETSAT and was not used. The control experiment against which the RADSST performance is measured is identical (in employing the outer-loop coupling approach), but in the control experiment no SKT increments from 4D-Var are passed to NEMOVAR as SST increments. The comparison between RADSST and the control experiment is thus showing the impact of forcing the NEMOVAR ocean SST with information from satellites in 4D‑Var. Figure 2 shows the mean change to SST when the infrared satellites are assimilated for the two periods. Some seasonal differences can be seen, in particular the changes to the Gulf Stream in the North Atlantic and to the Kuroshio Current on the western side of the North Pacific, but also some large positive changes in the Southern Ocean east of South America are common to both periods. It is perhaps reassuring to note that the largest changes resulting from the assimilation of radiances occur in regions of the ocean known to be highly dynamic and variable.

To get a first order indication of the realism of the RADSST radiance assimilation, we can compare both RADSST and the control to the OSTIA SST analysis. While OSTIA cannot be regarded as the truth (for the reasons discussed above under ‘Motivation’), it is a mature operational product incorporating a huge volume of in‑situ and satellite observations and should be more accurate than the control and RADSST, at least in the current prototype development phase of RADSST. For the winter period shown in Figure 3, it can be seen that RADSST is clearly closer to OSTIA in high-latitude regions of the Southern Ocean (east of South America). In the tropics, there are smaller and more mixed changes, with perhaps an improvement of the West Africa Guinea Current in RADSST. However, in the vicinity of the Gulf Stream and the Kuroshio Current very large differences to OSTIA persist in both the control and RADSST – an issue that will be covered later in this article.
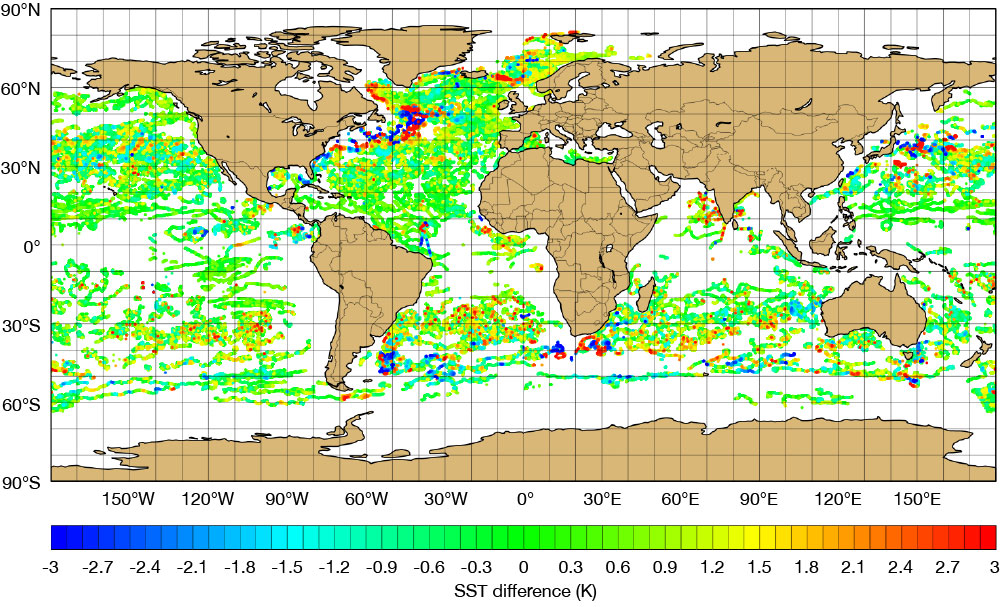
To verify the changes in a more quantitative manner, we have begun to look at how well the modified SST agrees with in-situ ocean drifter observations. There is a huge network of these measurements (as seen in Figure 4), but also a huge variety in sensor technology employed, with varying reliability. Unfortunately, many sensors are known to suffer significant quality issues since they employ different sensor technologies with varying reliability. Drifters can also be damaged or become entangled with shipping activity, with little or no information in the data report to distinguish good from extremely bad measurements. Initially, in collaboration with EUMETSAT, we will focus on using a special sub-sample of reference quality drifters deployed by the Copernicus Marine Service.
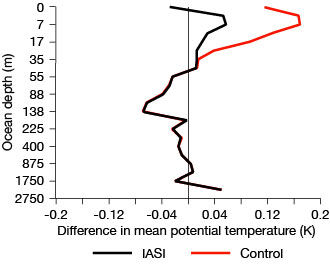
A crucial aspect of the outer-loop coupling approach is that, while the satellite radiances in 4D-Var only directly force the ocean surface, changes at the surface are propagated into the sub-surface by NEMOVAR (in a single analysis cycle) and (over time) by the ocean model dynamics (e.g. mixing, downwelling, etc). To verify these indirect changes below the surface, we have compared the RADSST and control ocean analyses to ARGO float observations in Figure 5. It can be seen that the cold bias compared to ARGO evident in the control system is significantly less in RADSST. There is also a small reduction of standard deviation not shown here. It is interesting to note that the indirect changes in the sub-surface ocean shown in Figure 5 can be just as large as the direct changes at the surface.
We expect changes in the ocean to feed back via outer-loop coupling into the atmospheric data assimilation system. This effect is seen most clearly by the fit to infrared satellites themselves. All three satellite systems show a significantly improved fit when they are allowed to force changes in the ocean (Figure 6). By doing so, in RADSST the ocean bulk SST and sub-surface retain a memory of the skin information from the satellites, which in the control is essentially discarded at the end of each 4D‑Var analysis cycle.

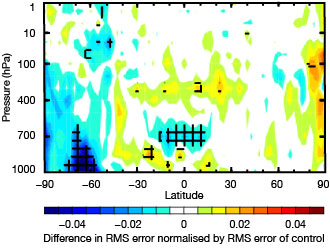
Finally, the whole purpose of this project is that we believe an improved ocean will allow us to produce better weather predictions. While the project is still at an early stage and RADSST is very much a prototype, we can already see some promising signals of benefits of ocean changes in atmospheric forecasts. In Figure 7, we see that the SST changes forced by radiances in the high-latitude Southern Ocean propagate into significantly improved temperature forecasts for the lower and mid‑troposphere.
Next steps
While the performance of the first ever trial of this novel approach is very encouraging, two significant developments are required before the system can be considered ready for pre-operational trials.
Firstly, in the current NEMOVAR assimilation system the NEMO ocean model trajectory is run at 1/4 degree spatial resolution. Many large-scale features of the ocean are accurately captured at this scale, but important boundary currents such as the Gulf Stream have significant systematic errors. The current is too weak to the south and incorrectly propagates warm water to the north of Cape Hateras instead of deflecting to the northeast (Figure 8). In RADSST, the infrared satellites try to apply increments to improve the representation, but the resulting analysis is overwhelmed by the model’s systematic biases. At the higher 1/12 degree resolution, the Gulf Stream is significantly better represented by the NEMO ocean model, and we plan to upgrade the outer-loop coupled RADSST system to this as soon as possible.

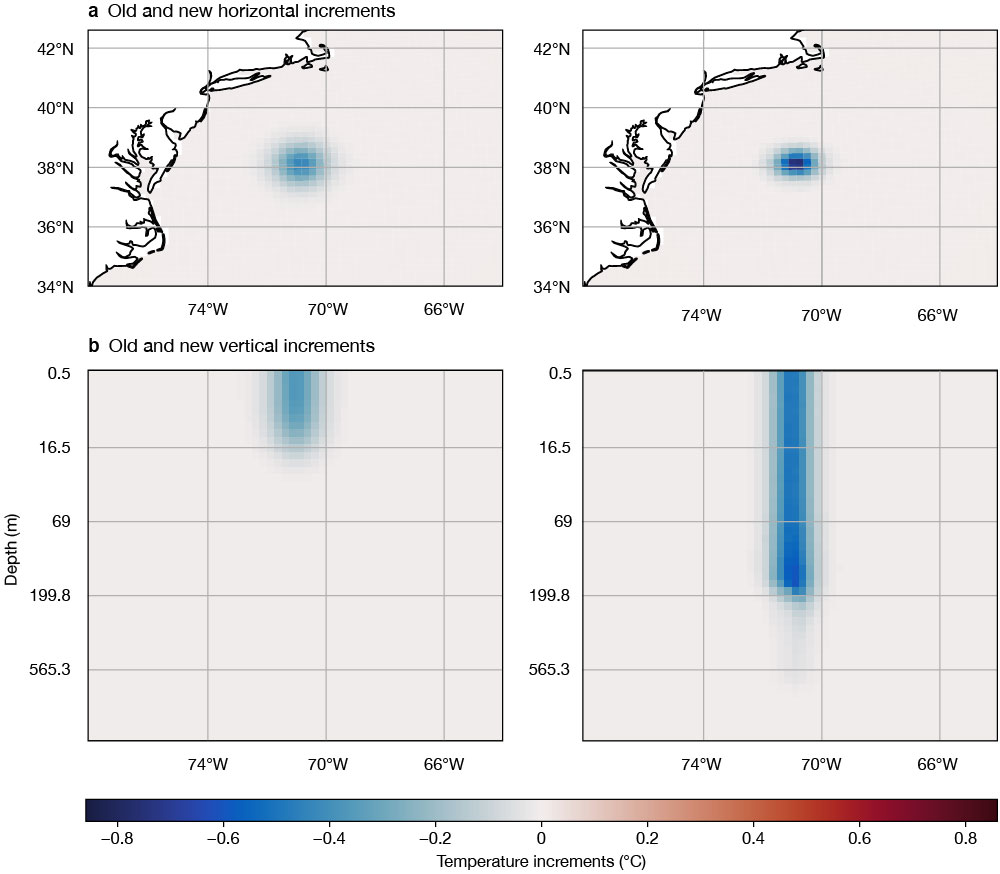
Secondly, an area where a significant upgrade is planned is in the NEMOVAR background error formulation. In these experiments, background errors were used as specified in the OCEAN5 reanalysis system and not reconfigured/optimised for dense surface observations from satellites (which we have in RADSST). During certain periods and at certain locations, we have observed the use of satellite information at the surface has degraded the ocean below (e.g. in comparison to ARGO). NEMOVAR background errors based on a hybrid Ensemble of Data Assimilations (EDA) have been developed which should significantly improve the horizontal and vertical propagation of satellite information from the surface to deeper layers below (Figure 9).
When these two major upgrades have been incorporated, we will re-evaluate the RADSST system performance and expect to see significant improvements in the resulting ocean analyses. Further into the future, the next priority is to investigate the exploitation of low-frequency microwave radiance observations. These have a slightly reduced ocean surface sensitivity compared to infrared data, but they are significantly less affected by clouds and could thus provide highly complementary information in regions of persistent cloud cover.
Further reading
Chrust, M., M.A. Balmaseda, P. Browne, M. Martin, A. Storto, A. Vidard et al., 2021: Ensemble of Data Assimilations in the ocean for better exploitation of surface observations, ECMWF Newsletter No. 168, 6–7.