In early 2022, ECMWF participated in the Atmospheric River Reconnaissance (AR Recon) observational campaign in the northeast Pacific. For ECMWF, the AR Recon campaign is important because the observations gathered improve the initial atmospheric conditions of ECMWF’s Integrated Forecasting System (IFS), and hence medium-range forecast skill. They also afford opportunities for diagnostic studies of the forecast system. Over the course of the campaign, ECMWF provided input to the weather forecast briefings which were used for flight planning, helped to identify the locations for the ocean buoy deployments, and undertook real-time monitoring of the observations assimilated into the IFS.
The aim of AR Recon is to improve the forecast skill of landfalling atmospheric rivers and their impacts to better inform the decision-makers who are responsible for water management and flood preparedness in the western United States. To achieve this objective, AR Recon has been set up as a Research and Operations Partnership by the Center for Western Weather and Water Extremes (CW3E) at Scripps Institution of Oceanography and the US National Weather Service/National Centers for Environmental Prediction. Its core partners include the US Naval Research Laboratory, the NOAA (National Oceanic and Atmospheric Administration) Aircraft Operations Center, the US Air Force Reserve Command, the National Center for Atmospheric Research, ECMWF, and multiple academic institutions. The campaign is also formally incorporated in the US National Winter Season Operations Plan. Although AR Recon currently has a northeast Pacific focus, any forecast improvements made in this domain have downstream benefits for Europe and the whole IFS.
Scope of the deployment
In the 2022 season, 50 drifting ocean buoys were deployed in the northeast Pacific via (1) a ship of opportunity from Los Angeles to Honolulu and from Honolulu to San Francisco and (2) US Air Force Reserve Command flights (see the top figure). The sea-level pressure observations from these buoys were assimilated into the IFS shortly after their release, and they will continue to be used over the operational lifetime of the buoys, which can exceed two years. The Lagrangian Drifter Laboratory and CW3E, both at Scripps Institution of Oceanography, led the deployment planning, with funding from the NOAA Global Drifter Program (https://gdp.ucsd.edu/ldl/global-drifter-program/), the California Department of Water Resources, and the U.S. Army Corps of Engineers. Two types of buoys were deployed: 10 Directional Wave Spectra Barometer drifters (DWSB; https://gdp.ucsd.edu/ldl/dwsbd/) and 40 Surface Velocity Program Barometer drifters (SVPB; https://gdp.ucsd.edu/ldl/svpb/). Like the SVPB drifters, the DWSB drifters measure sea-surface temperature and barometric pressure. However, DWSB drifters also compute the directional wave spectrum via a high-performance GPS engine. The locations of the new buoys – 48 of which were seen by the IFS on 21 February 2022 – are shown by the red markers in the figure. These add to earlier buoy deployments as part of AR Recon (Newsletter No. 159 and No. 163).
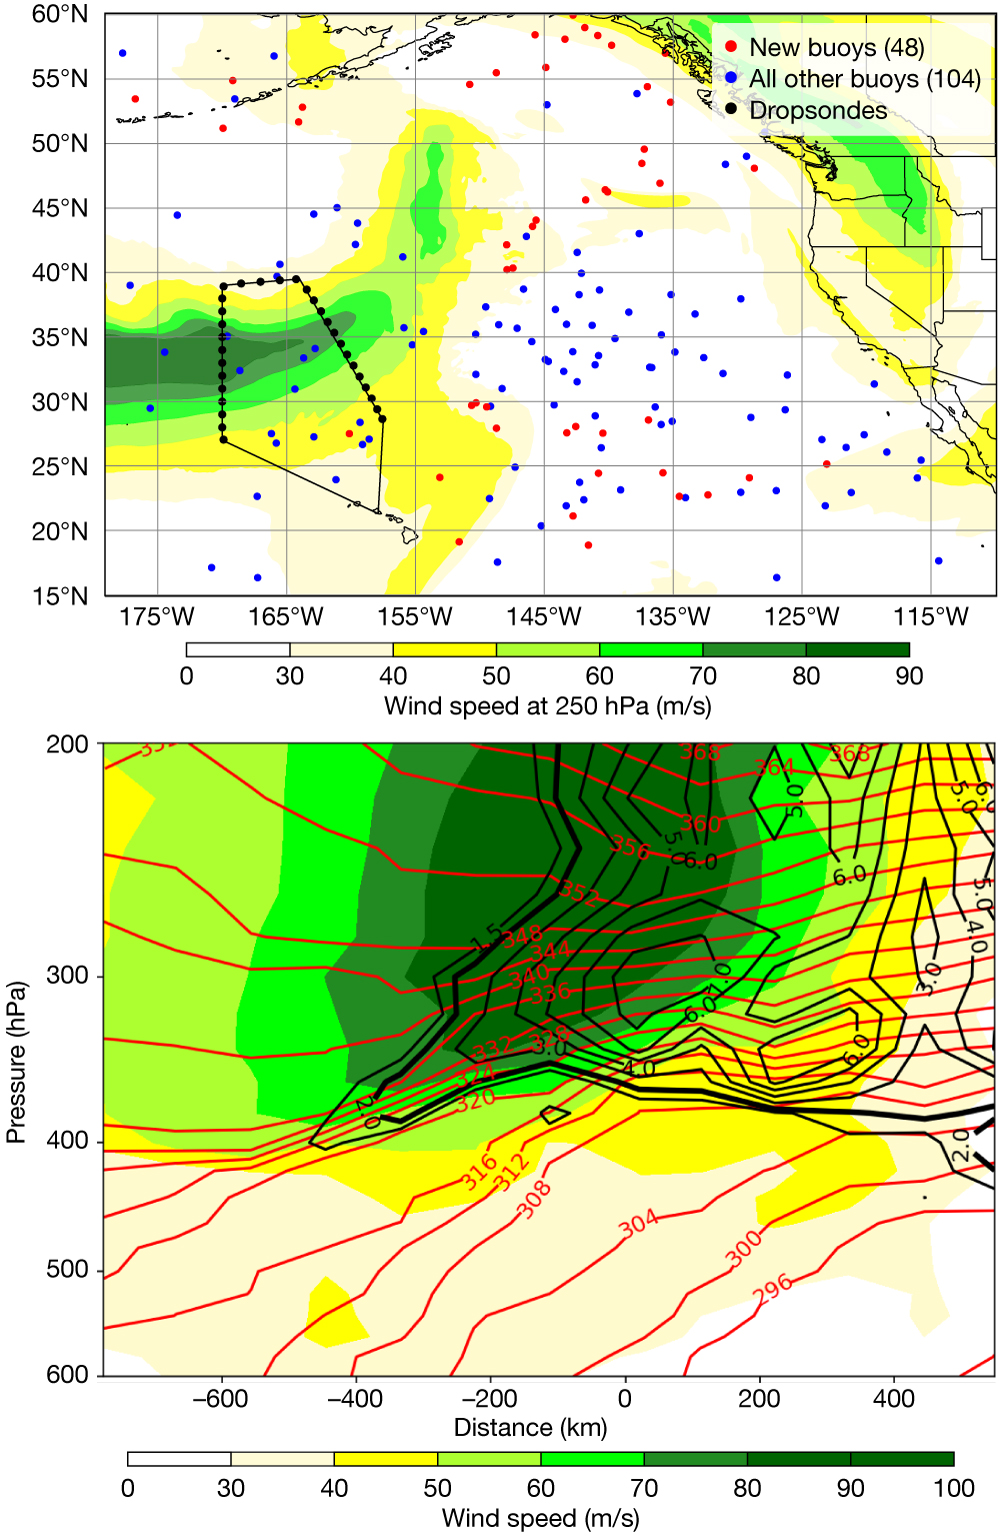
In addition to the buoy deployments, a number of dropsondes were also deployed during intensive observing periods (IOPs). Each IOP, which has up to three aircraft flying simultaneously, releases dropsondes to collect observed atmospheric profiles of the specific humidity, temperature, and winds. The locations of the dropsondes in an IOP centred on 00 UTC 3 February 2022 are shown by the black markers in the top figure. During a flight out of Honolulu, the NOAA G-IV aircraft deployed 30 dropsondes across the jet stream, where a wind speed of over 100 m/s was observed. This IOP will provide a unique opportunity to evaluate the jet stream structure in the IFS at various lead times. The cross section through the jet stream along 170°W longitude, as constructed with the dropsonde observations, is shown in the bottom figure. This cross section features a prominent upper-level front that extends down to 400 hPa underneath the jet, and this feature was not well represented in model analyses and forecasts (not shown).
Previous AR Recon diagnostic studies at ECMWF can be found in Lavers et al. (2018; doi. org/10.1029/2018GL079019) and Lavers et al. (2020; doi.org/10.1175/ WAF-D-20-0049.1). Further information on the pressure observations from drifting buoys is available in Ingleby & Isaksen (2018; doi.org/10.1002/asl.822) and Centurioni et al. (2017; doi. org/10.1175/BAMS-D-15-00080.1).