Visible radiances contain a wealth of information on clouds. They are available at high horizontal resolution and are sensitive to the full depth of clouds in the atmosphere. However, assimilating visible radiances poses challenges due to the complex scattering of light. As such, they have never been assimilated in global numerical weather prediction models. ECMWF is currently performing monitoring experiments of cloudy visible radiances, as a first step towards their possible future implementation in operational data assimilation. In monitoring experiments, the first-guess departures (the differences between the observations and the model background) are calculated, but they are not used to adjust model fields in the assimilation.
Visible radiance data
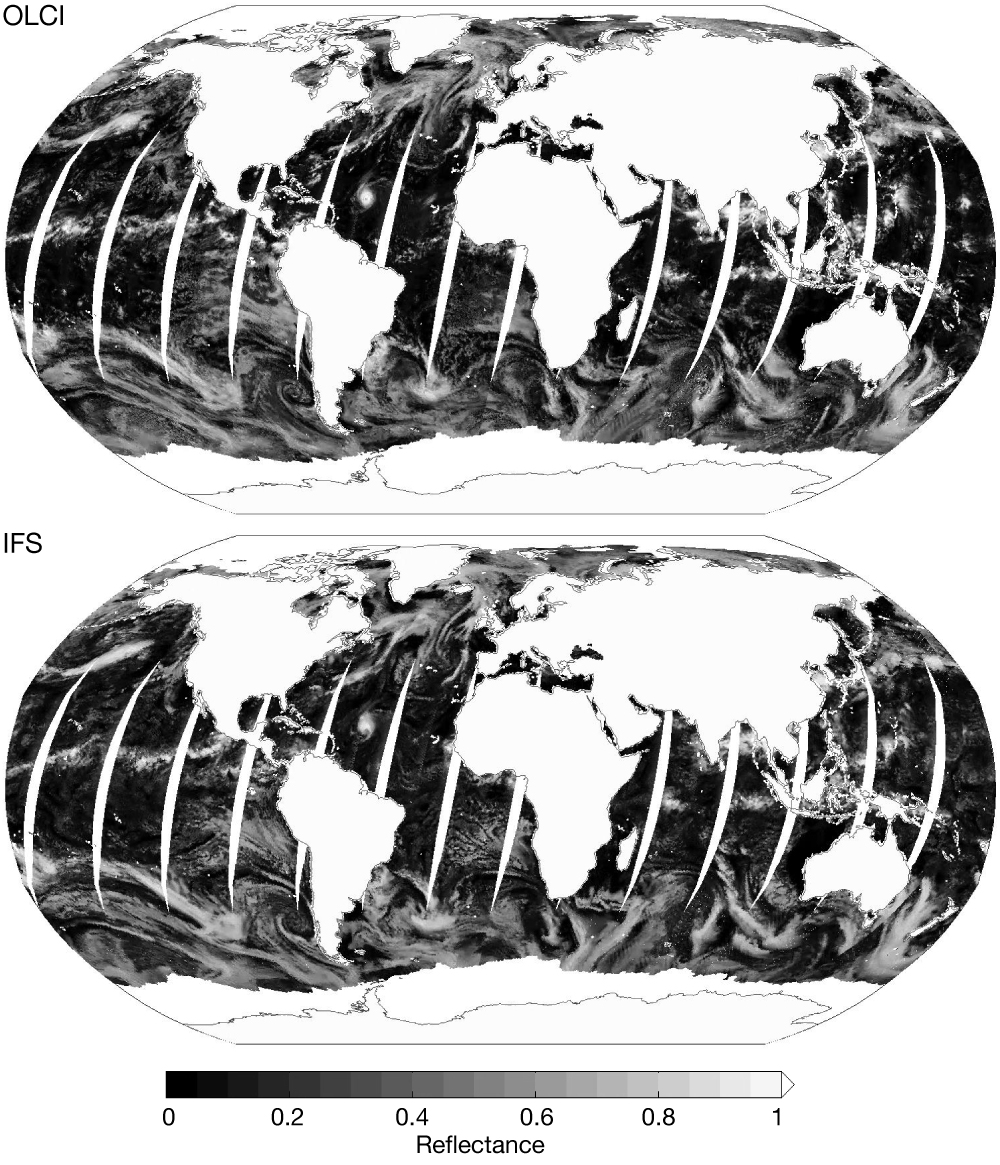
For the monitoring experiments, we are using data from the Ocean and Land Colour Imager (OLCI) instruments, OLCI-A and OLCI-B, which are aboard Sentinel-3A and Sentinel‑3B respectively. The data have a swath width of 1,270 km at nadir, with a ground spatial resolution of 300 m. We are using data at a wavelength of 665 nm, as this is little affected by absorption in the atmosphere, so there is only a minor impact on the reflected solar radiation.
To enable comparisons against predictions of ECMWF’s Integrated Forecasting System (IFS), we convert the spectral radiances into reflectances. The data are transformed (‘superobbed’) to a resolution of 30 km, as this more closely resembles the resolution of the monitoring experiments. Due to the complexities of the scattering of visible radiation from land and ice surfaces, we are only using data over ice-free oceans.
To calculate reflectances in the IFS, we are using the Method for Fast Satellite Image Synthesis (MFASIS), which is based on a reflectance look-up table. For MFASIS, the state of the atmosphere is described by only a few parameters: total optical depths, and vertically-averaged effective radii of liquid water and ice.
Preliminary results
Experiments have been performed to monitor cloud prediction during September 2021. As the edges of cloudy regions tend to have sharp gradients in reflectance, the first-guess departures reveal where clouds in the IFS, and hence temperatures or humidities, are likely to differ from reality. The majority of the large-scale synoptic cloud features are represented in the IFS, particularly clouds along frontal boundaries. The locations of large areas of convection, such as those in the Intertropical Convergence Zone, are also captured well, though the IFS reflectances tend to be lower. Smaller-scale cloud features, such as individual convective cells or regions of altocumulus, tend to be less well captured.
The monitoring period includes Hurricane Larry, which began as a tropical storm on 1 September and reached peak intensity as a category 3 hurricane on 5 September, with winds of 125 mph. In general, the location of the hurricane in the IFS is in close agreement with the observations throughout its lifespan, although the presentation of the eye and the structure of the cloud bands show some discrepancies.
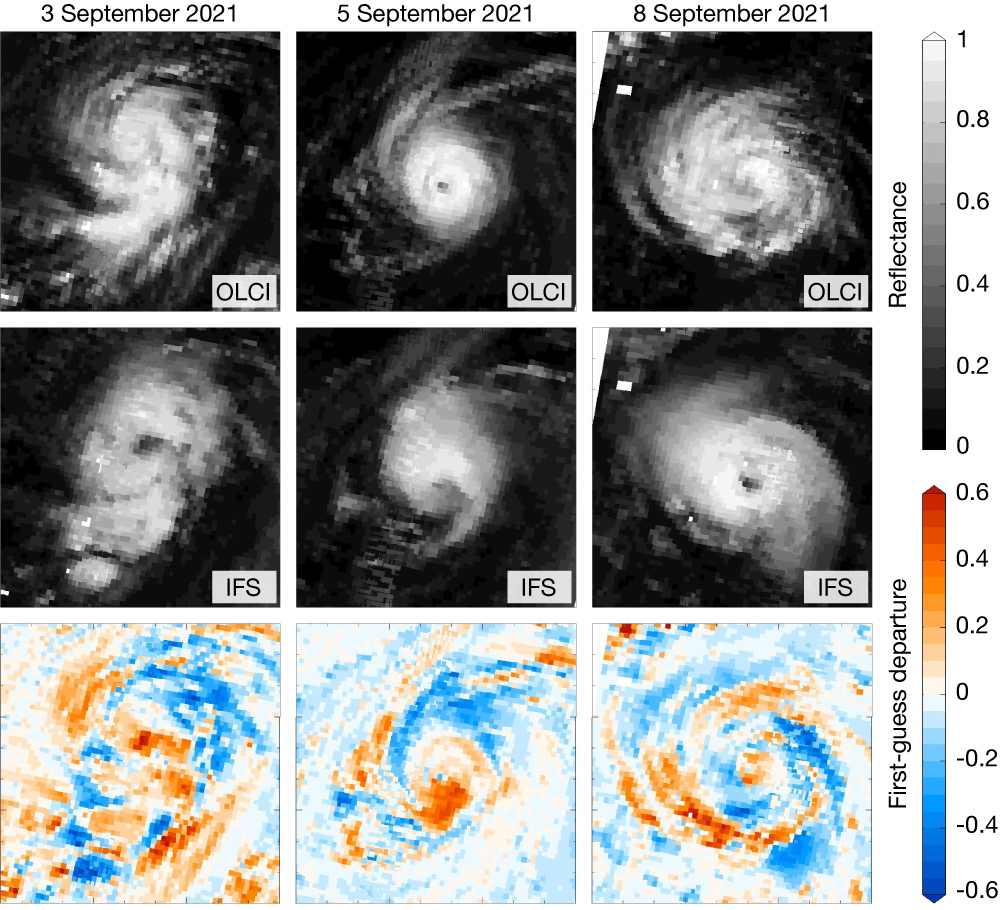
The monitoring experiments performed so far reveal the potential benefit of visible data assimilation. The first-guess departures provide information ranging from the large scale, such as highlighting where regions of frontal clouds are located, to the smaller scale, such as revealing the structure of hurricanes and convective cells. While the analysis here has been performed with 30 km resolution data, visible data are available at much higher resolutions. Thus, as the resolution of forecasting models increases over time, it is possible that even more benefit can be obtained from the observations, as the structure of smaller-scale cloud features in models improves. While there are many instruments operating today that could be used for visible data assimilation, there is also a wealth of visible observations stretching back many decades, which could be exploited for reanalysis applications. Thus, there appears to be great potential for visible data assimilation.