On 24 and 25 January 2019, a band of freezing rain affected south-eastern Europe and especially Romania. The precipitation rate was almost 1 mm/h for several hours, leading to a thick layer of ice on the ground. Motorways and many other national roads in the southern and eastern part of the country were closed from the evening of 24 January to the morning of 25 January, and many trains and flights were delayed or cancelled. Ice deposits on electrical cables led to power cuts, and the emergency services reported about 100 people with fractures or sprains due to falling on the ice.
The freezing rain event was associated with a deep Mediterranean cyclone that formed over the Gulf of Genoa on 23 January. Over the following two days, this low pressure system moved initially to the southeast and later eastwards towards Greece, bringing adverse weather conditions to the Balkan Peninsula. A combination of warm advection aloft in the eastern flank of the upper-level low and cold advection from the north and northeast near the surface created favourable conditions for freezing rain that affected southern and eastern Romania on 24 and 25 January.

Predicting freezing rain
In freezing rain conditions, precipitation falls through a layer of air whose temperature is above zero and which is thick enough for the precipitation to have time to melt, before passing through a colder layer closest to the ground producing super-cooled water, which turns to ice when it hits the ground. Such a temperature profile was evident in the radiosonde sounding from 00 UTC on 25 January from Bucharest. In a warm layer between 910 hPa and 860 hPa the temperature was above freezing, while the 2‑metre temperature was –0.5°C.
Since 2015, ECMWF has produced freezing rain precipitation type as a model diagnostic. To be able to predict the correct precipitation type at the surface, including freezing rain, the atmospheric model needs to predict the vertical temperature profile and the amount of precipitation sufficiently accurately, but must also include the correct physics for the melting and refreezing processes. The diagnostic is described in ECMWF Newsletter No. 141. Subsequently the precipitation type diagnostic was used for new ensemble-based probabilistic precipitation type products, described in ECMWF Newsletter No. 154.

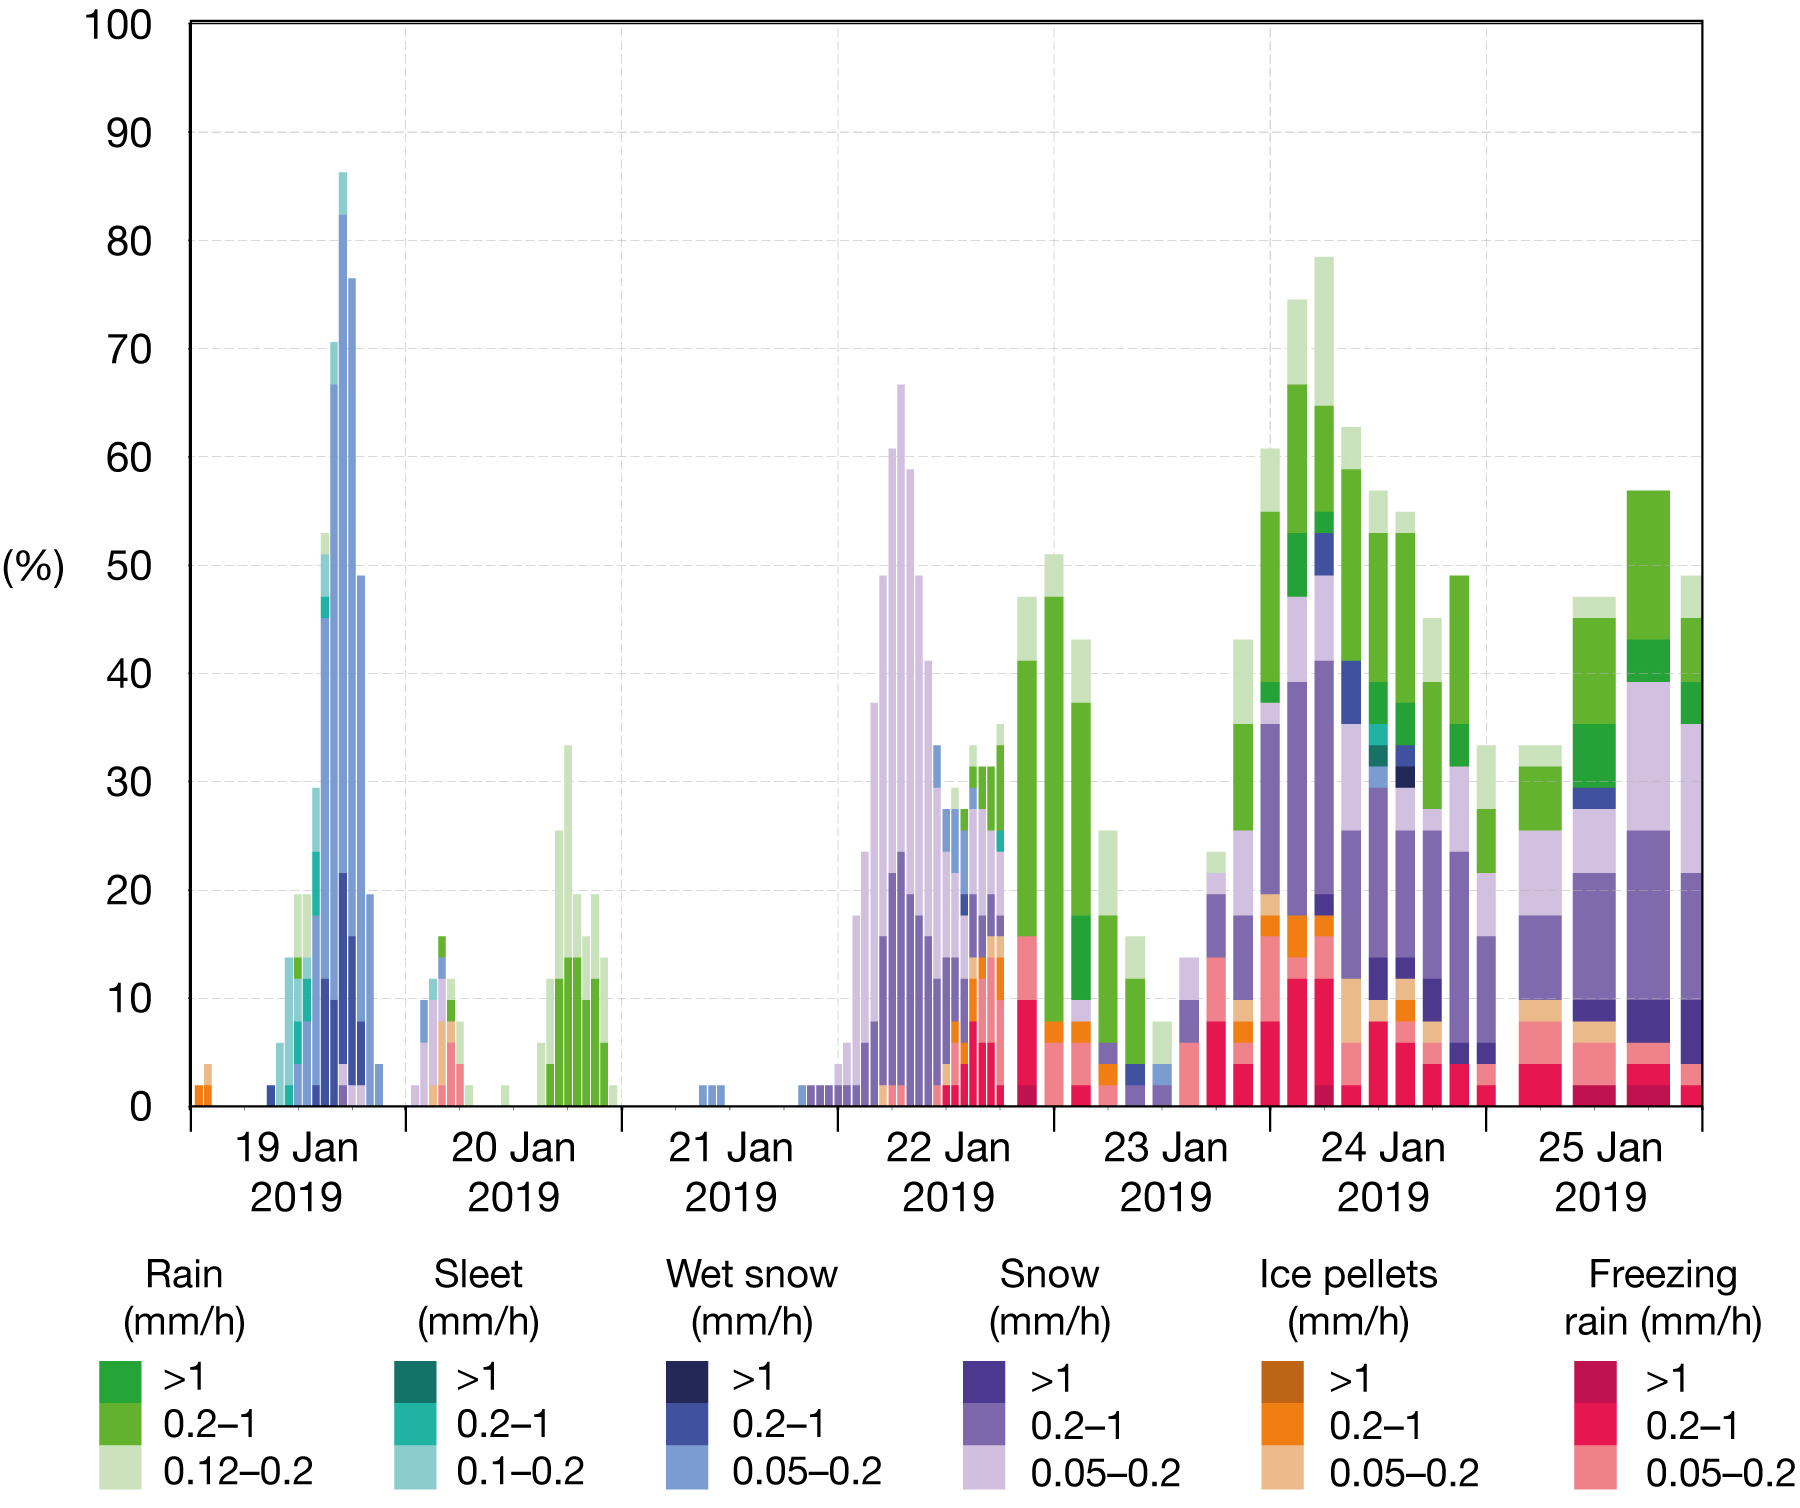
ECMWF’s forecasts of the event
In the forecast from 21 January 00 UTC, the probability for more than 5 mm/24 h of freezing rain (a threshold representing a severe event) in the affected area reached 30% for 24 January 06 UTC to 25 January 06 UTC. This shows that the forecast was able to capture the horizontal structure of the event three to four days ahead of the event. For point forecasts, ECMWF has developed a special ensemble product for precipitation type showing the probability of precipitation. It depicts the temporal evolution of probabilities (in per cent) for a specific location in the form of a bar chart. Probabilities are calculated from the instantaneous precipitation type variable. Different colours represent different precipitation types and different hues provide details on the probability of different instantaneous precipitation rates for different precipitation types. The information on precipitation rates can be key for determining the severity of a potential freezing rain event. Three different rate categories are used: < 0.2 mm/hour, 0.2–1 mm/hour and > 1 mm/hour. As an example, we show the forecast for Bucharest from 19 October, five to six days before the event. It shows an elevated risk for freezing rain on 24 and 25 October. Although the probabilities for freezing rain are low, the forecast gives an early indication of a possible freezing rain event five to six days later.