
In 2016, the World Meteorological Organization (WMO) initiated the South-East European MultiHazard Early Warning Advisory System (SEE-MHEWS‑A) project, which aims to strengthen the existing early warning capacity in the region. The project finished its first phase in 2017, which delivered an implementation plan. The project is now finalising the second phase, which is the implementation of a prototype of an operational system. ECMWF has been supporting this work, and several of our services have been used in the implementation. See Box A for more information on SEE-MHEWS‑A.
Since 2019, ECMWF has been involved in the project by providing expertise and support in: (i) observational data handling; (ii) setting up limited-area numerical weather prediction (NWP); (iii) setting up hydrological models over the area; and (iv) supporting the development of a web-based Common Information Platform (CIP).
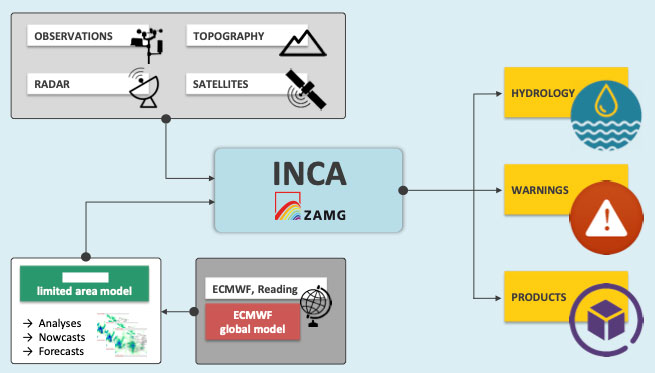
The pilot phase of the project has so far been a success. Several countries in the region have agreed to share more of their observational data within the project. The data are handled by the Scalable Acquisition and Pre-Processing (SAPP) system at ECMWF and are now used in data assimilation for ECMWF’s forecasts. Furthermore, the four NWP models in the project have all been implemented by ECMWF Member and Co-operating States and are running in real time, some as time-critical applications. Three hydrological models have been calibrated over the region and now run quasi-operationally. A web-based platform for disseminating the products is being developed and is hosted on the European Weather Cloud (EWC). The EWC also hosts a nowcasting component. Figure 1 shows a conceptual diagram of the tools used at ECMWF to deliver the system.

Acquisition, pre-processing and use of observations
One of the goals of the pilot phase of the SEE-MHEWS‑A project was to acquire and pre-process additional meteorological observations not yet distributed on the Global Telecommunication System (GTS), or having higher reporting frequency, and make them available for data assimilation. ECMWF achieved this goal by utilising the ECMWF Production Data Store (ECPDS) and the Scalable Acquisition and Pre-Processing (SAPP) system.
The ECPDS acquisition service/portal is used for automatic data retrieval (relying on ftp, sftp, and https protocols); both public and private accounts were created to support participating countries’ needs to transfer public and/or reserved data. Files acquired by ECPDS are sent to the SAPP data driven processing system, responsible for observation decoding, initial format and quality control, and conversion to a consolidated ECMWF BUFR format before extractions for data assimilation. One of the advantages of using the SAPP system is the ability to configure new processing chains for the newly developed encoders for the project.
A
Scope and aims of SEE-MHEWS-A
The SEE-MHEWS‑A project is supported by the following WMO national meteorological and hydrological services (NMHSs) in southeast Europe: Albania, Bosnia and Herzegovina, Bulgaria, Croatia, Cyprus, Greece, Hungary, Israel, Jordan, Lebanon, North Macedonia, Republic of Moldova, Montenegro, Romania, Slovenia, Turkey, and Ukraine. Of these 17 countries, ten are ECMWF Member or Co-operating States. The project’s aims are to:
- strengthen regional cooperation by leveraging national, regional and global capacities to develop improved hydro-meteorological forecasts, advisories and warnings to save lives and limit economic losses
- strengthen national multi‐hazard early warning systems making tools and data available to the participating countries and other beneficiaries
- implement impact‐based forecasts and risk‐based warnings to support governments, disaster management authorities, humanitarian agencies and NGOs in their decision-making
- harmonise forecasts and warnings in trans‐ boundary areas
- provide training on operational forecasting for staff of the NMHSs participating in the project.
For more details, see: https://public.wmo.int/en/projects/see-mhews-a.
To facilitate provisioning of additional meteorological observations that could not be provided in BUFR format, a custom SYNOP CSV data exchange format and an ecCodes-based CSV to BUFR converter was developed. This includes handling of local and national identifiers for stations not yet registered in the WMO OSCAR database. The SAPP system has also been used to validate and process sub-hourly BUFR SYNOP observations that Slovenia started to circulate on the GTS in June 2021. Furthermore, SAPP extractions have been configured to feed SEE-MHEWS‑A data assimilation, hydrological verification, and CIP for display purposes.
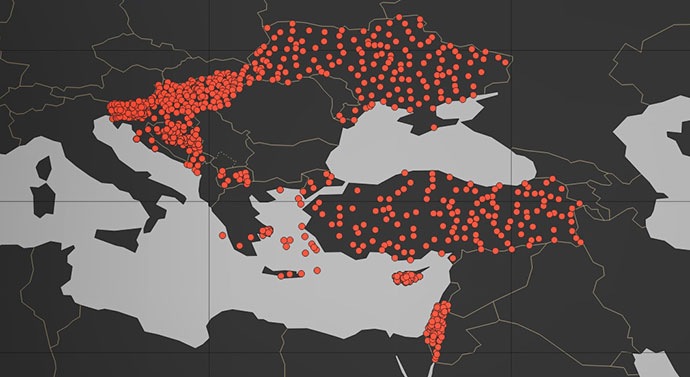
Thanks to this joint effort, it was possible to start exchanging many additional observations not available on the GTS (Tables 1 and 2). As of August 2021, Bosnia and Herzegovina, the Republic of Croatia, Cyprus, Hungary, Montenegro, the Republic of North Macedonia, the Republic of Turkey and Ukraine are all submitting SEE-MHEWS‑A observations regularly in near-real-time (NRT). Israel and Slovenia are providing all their in-situ observations on the GTS. ECMWF provided SAPP technical support for BUFR processing and extraction to participant countries such as Turkey, which utilise SAPP in their local environment.
| Country | Number of stations – GTS | Number of additional stations through SEE-MHEWS-A | Total number of reports/day – GTS | Total number of additional reports/day through SEE-MHEWS-A |
|---|---|---|---|---|
| Bosnia and Herzegovina | 14 | 63 | 222 | 9072 |
| Republic of Croatia | 40 | 4 | 683 | 576 |
| Cyprus | 4 | 37 | 43 | 5328 |
| Greece | 44 | 11 | 282 | 82 |
| Hungary | 30 | 90 | 496 | 2160 |
| Montenegro | 6 | 4 | 120 | 80 |
| Republic of North Macedonia | 17 | 11 | 113 | 1584 |
| Republic of Turkey | 122 | 144 | 1640 | 3456 |
| Ukraine | 36 | 127 | 288 | 1016 |
| Total Number | 312 | 491 | 3887 | 26354 |
| Country | Pressure – 4D-Var | 2-metre relative humidity – 4D-Var | 2-metre temperature – LDAS | 2-metre relative humidity – LDAS | Snow depth – LDAS |
|---|---|---|---|---|---|
| Bosnia and Herzegovina | 12 | 1 | 63 | 47 | 0 |
| Republic of Croatia | 4 | 4 | 4 | 1 | 1 |
| Cyprus | 9 | 3 | 30 | 3 | 0 |
| Greece | 8 | 3 | 9 | 9 | 1 |
| Hungary | 21 | 19 | 87 | 86 | 0 |
| Montenegro | 2 | 0 | 3 | 3 | 2 |
| Republic of North Macedonia | 9 | 2 | 10 | 10 | 2 |
| Republic of Turkey | 114 | 46 | 130 | 130 | 7 |
| Ukraine | 122 | 110 | 126 | 126 | 7 |
| Total Number | 301 | 118 | 462 | 415 | 133 |
The additional measurements provided as part of the SEE-MHEWS-A project started to be assimilated operationally in November 2020 by ECMWF’s upper air 4D-Var system and the Land Data Assimilation System (LDAS). The ECMWF operational analysis (both 4D‑Var and LDAS) and the high-resolution forecast (HRES) are run on ECMWF’s HPCF. ECMWF analysis and HRES forecasts are then used to provide initial conditions (IC) and lateral boundary conditions (LBC) used by the limited-area models (LAM) and nowcasting system run as part of the SEE-MHEWS‑A project. The required files are produced using ECMWF’s product generation (PGEN) system and then transferred, using ECMWF’s dissemination system (ECPDS), to the required file system. This is either on the HPCF for the LAM runs or on the object data store (S3 buckets) for the nowcasting system run on the European Weather Cloud (Figure 1).
In addition to IC and LBC from ECMWF’s Integrated Forecasting System (IFS), the ALADIN-ALARO LAM system uses its own data assimilation based on three hourly cycles with 3D-Var for assimilation of atmospheric variables and Optimal Interpolation for assimilation of soil fields. The main forecast is run twice per day, at 00 and 12 UTC.
The main observations assimilated are collected and processed by the common pre-processing system of the RC LACE consortium (OPLACE) hosted by the Hungarian Meteorological Service (HMS). The system is pre-processing surface, aircraft, radiosonde and wind profile observations as well as atmospheric motion vectors, satellite radiances and scatterometer data.
Similar SAPP extractions of the SEE-MHEWS-A observations in CSV format to the HPCF have been set for the needs of one of the hydrological models used (HBV).
Meteorological modelling
The limited-area NWP component of the SEEMHEWS-A project consists of four models (see Table 3) with the aim of providing high-resolution, short-range weather forecasts, but also initial and boundary conditions for hydrological models and nowcasting.
| Model | Responsible centre |
|---|---|
| ALADIN-ALARO (Aire Limitée Adaptation dynamique Développement InterNational) | ARSO (Slovenian Environmental Agency) |
| COSMO (Consortium for Small-scale Modeling) | HNMS (Hellenic National Meteorological Service) |
| ICON (Icosahedral Nonhydrostatic model) | IMS (Israel Meteorological Service) |
| NMM-B (Nonhydrostatic Multi-scale Model on B grid) | UoB (University of Belgrade) |
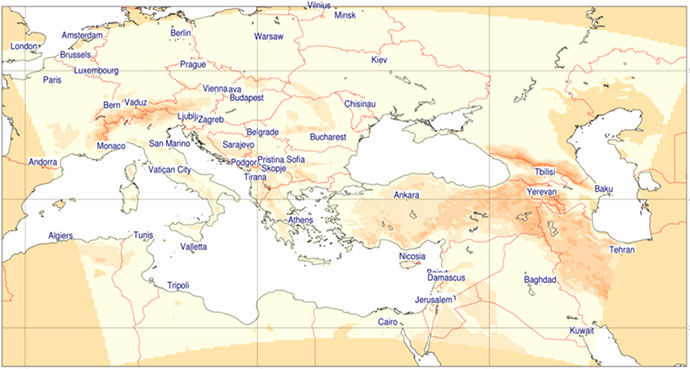
Three models are configured to share the same domain (from 9.4°E to 45°E, and from 28.5°N to 52.5°N) and a spatial resolution of 2.5 km (Figures 2 and 3). Only COSMO is run on a slightly coarser resolution of 4 km because the system was configured before the start of the SEE-MHEWS-A project and some time is needed for adjustments to the project requirements. Each model is run twice per day, with starting times of 00 and 12 UTC, using ECMWF’s HRES for IC and LBC over a forecasting period of 72 hours.
Meteorological outputs from NWP models are consistent between models, and include outputs for hydrological modelling, verification, nowcasting, and the CIP. They include commonly used surface and standard pressure level fields. All models are managed by their corresponding ecFlow suites. The ecFlow servers are run on a dedicated virtual machine or on ecgate with all suite components hosted by the ECMWF HPCF. IC and LBC are disseminated via the ECPDS directly to the HPCF.
While COSMO and ICON run as Time-Critical option 2 suites, ALADIN-ALARO and NMM‑B run in near-real time at this stage of the project. The model outputs are kept on the HPCF for one month, so that the latest runs are quickly available to other project components, such as hydrology. The same outputs are archived in ECMWF’s file storage system (ECFS) to make historical runs available to the project participants. Outputs for CIP and nowcasting are disseminated via ECPDS to the S3 object store in the European Weather Cloud, where these project components run.
Verification of NWP output
An important activity of the SEE-MHEWS‑A project is the verification of the performance of the NWP models. A comparison of the results in a structured, region-wide forecast verification procedure is a necessary component of the agreed process to establish a multi-hazard early warning advisory system in southeast Europe. The application of the verification methodology agreed in the project aims to evaluate the performance of several NWP models. The five models available for verification are: ALADIN-ALARO, COSMO, ECMWF IFS HRES, ICON, and NMM‑B.
The 00 UTC initialisation model runs are used for the verification of the 24 h cumulative precipitation forecast. To avoid the model spin-up period, only the data from 06 UTC to 54 UTC is used, forming a forecast range up to two days ahead. The ALADIN, ICON and NMM‑B model resolutions are ~2.5 km, COSMO’s is ~4 km, and the ECMWF‑IFS model resolution is ~9 km. For comparison with observations, model forecast data are extracted for the nearest model grid point over land. The verification methodology is applied on 24 h cumulative precipitation data gathered from the available observing stations in each country for the period from 22 September 2020 to 22 November 2020. As part of the project, by applying the above verification methodology, a set of country-specific verification reports has been produced by DHMZ, the Croatian Meteorological and Hydrological Service (Table 4).
| Model | Correlation coefficient | Bias (mm/24 h) | Mean absolute error (mm/24 h) | Root-mean-square error (mm/24 h) |
|---|---|---|---|---|
| ALADIN | 0.76* | 2.55* | 3.83* | 8.74 |
| COSMO | 0.58* | 0.35 | 3.45 | 9.66 |
| ECMWF | 0.68 | 0.70 | 2.92 | 8.09 |
| ICON | 0.69 | 0.84 | 3.00 | 8.82 |
| NMM-B | 0.60* | 0.15 | 3.38 | 8.71 |
Nowcasting
Nowcasting is becoming increasingly important for warnings of high-impact weather and numerous other applications. As part of the SEE-MHEWS‑A project, the Austrian Zentralanstalt für Meteorologie und Geodynamik (ZAMG) is piloting the multivariable analysis and nowcasting system INCA for a specific area in Bosnia and Herzegovina (Figure 4). INCA provides near-real-time analyses and forecasts of several surface fields. Its objective is to improve numerical forecast products in the nowcasting (0–4 h) and very short (up to about 12 h) ranges (Haiden et al., 2011). INCA has a very high-resolution spatial and temporal system. It can currently provide weather analyses and nowcasting for a 100 m2 to 1 km2 grid and has a rapid update cycle, running every five minutes to one hour depending on data availability, weather parameters and application requirements.
INCA analysis merges, in real time, the available observations of automatic weather stations, radars and satellites, forecasts of NWP models, and very high-resolution geographical and topographic data. As a multivariable system, INCA provides real-time analyses and nowcasting for precipitation amounts and types as well as for temperature, humidity, wind, cloudiness, snow fall line, ground temperature, convective parameters, global radiation, and so on.
ZAMG has implemented a version of INCA on the European Weather Cloud at ECMWF, using all available in-situ measurements from the area, including additional SYNOP and radar observations provided as part of the SEE-MHEWS-A project. The INCA configuration as of 31 August 2021 is tailored to the specific requirements of the project and to the current data availability. The current domain is 16.5°–17.9°E, 43.7°–45.3°N, with a spatial resolution of 1 km, covering the Vrbas river catchment area in Bosnia and Herzegovina. Despite the high temporal resolution of the rain gauge observations (10 minutes), the update frequency of INCA precipitation is set to 20 minutes because the radar is currently provided at 20‑minute intervals. INCA was implemented in the European Weather Cloud using the latest Python-based version of the code at ZAMG. Adjustments and optimisations due to improved or additional data provision and/or feedback by local experts can be easily undertaken within the project.
Hydrological modelling
The hydrological models used in the project are LISFLOOD (the hydrological model used in the European Flood Awareness System, EFAS; Smith et al., 2016), HBV and WFLOW. The HBV and LISFLOOD hydrological models were in the pilot phase set up over the Vrbas catchment in Bosnia and Herzegovina, and the WFLOW model was set up over the Vardar catchment in North Macedonia. Setting up the models entails adjusting the river network and making sure all static maps are in place, as well as calibrating the models using hydrological and meteorological observations from the catchment that were gathered and processed for this purpose. It is planned that the models be expanded to larger regions in the next phase of the project.
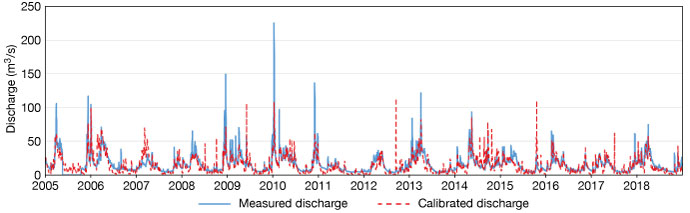
The LISFLOOD model was calibrated using similar tools to those developed for EFAS. Quite a substantial amount of development work was needed to adjust the tools to work over a single catchment such as the Vrbas. The calibration resulted in an improvement of performance of the stations in the catchment. An example of the calibration is shown in Figure 5.
LISFLOOD is implemented on the ECMWF HPCF using ecFlow. The workflow is that the model picks up observational data (precipitation and temperature) from the EFAS data flow and calculates the hydrological initial conditions. Then it retrieves the NWP data produced over the region and runs them through the hydrological model. Finally, products for the web are generated and are sent to the CIP for dissemination.
The LISFLOOD and HBV models were both set up to run on ECMWF’s HPCF as part of our support for the project. WFLOW is set up using FEWS, which is a piece of open software that handles data flow, calibration and verification. The output of the hydrological models is transformed to JSON files for a flexible integration of the information on the CIP.
The Common Information Platform (CIP)
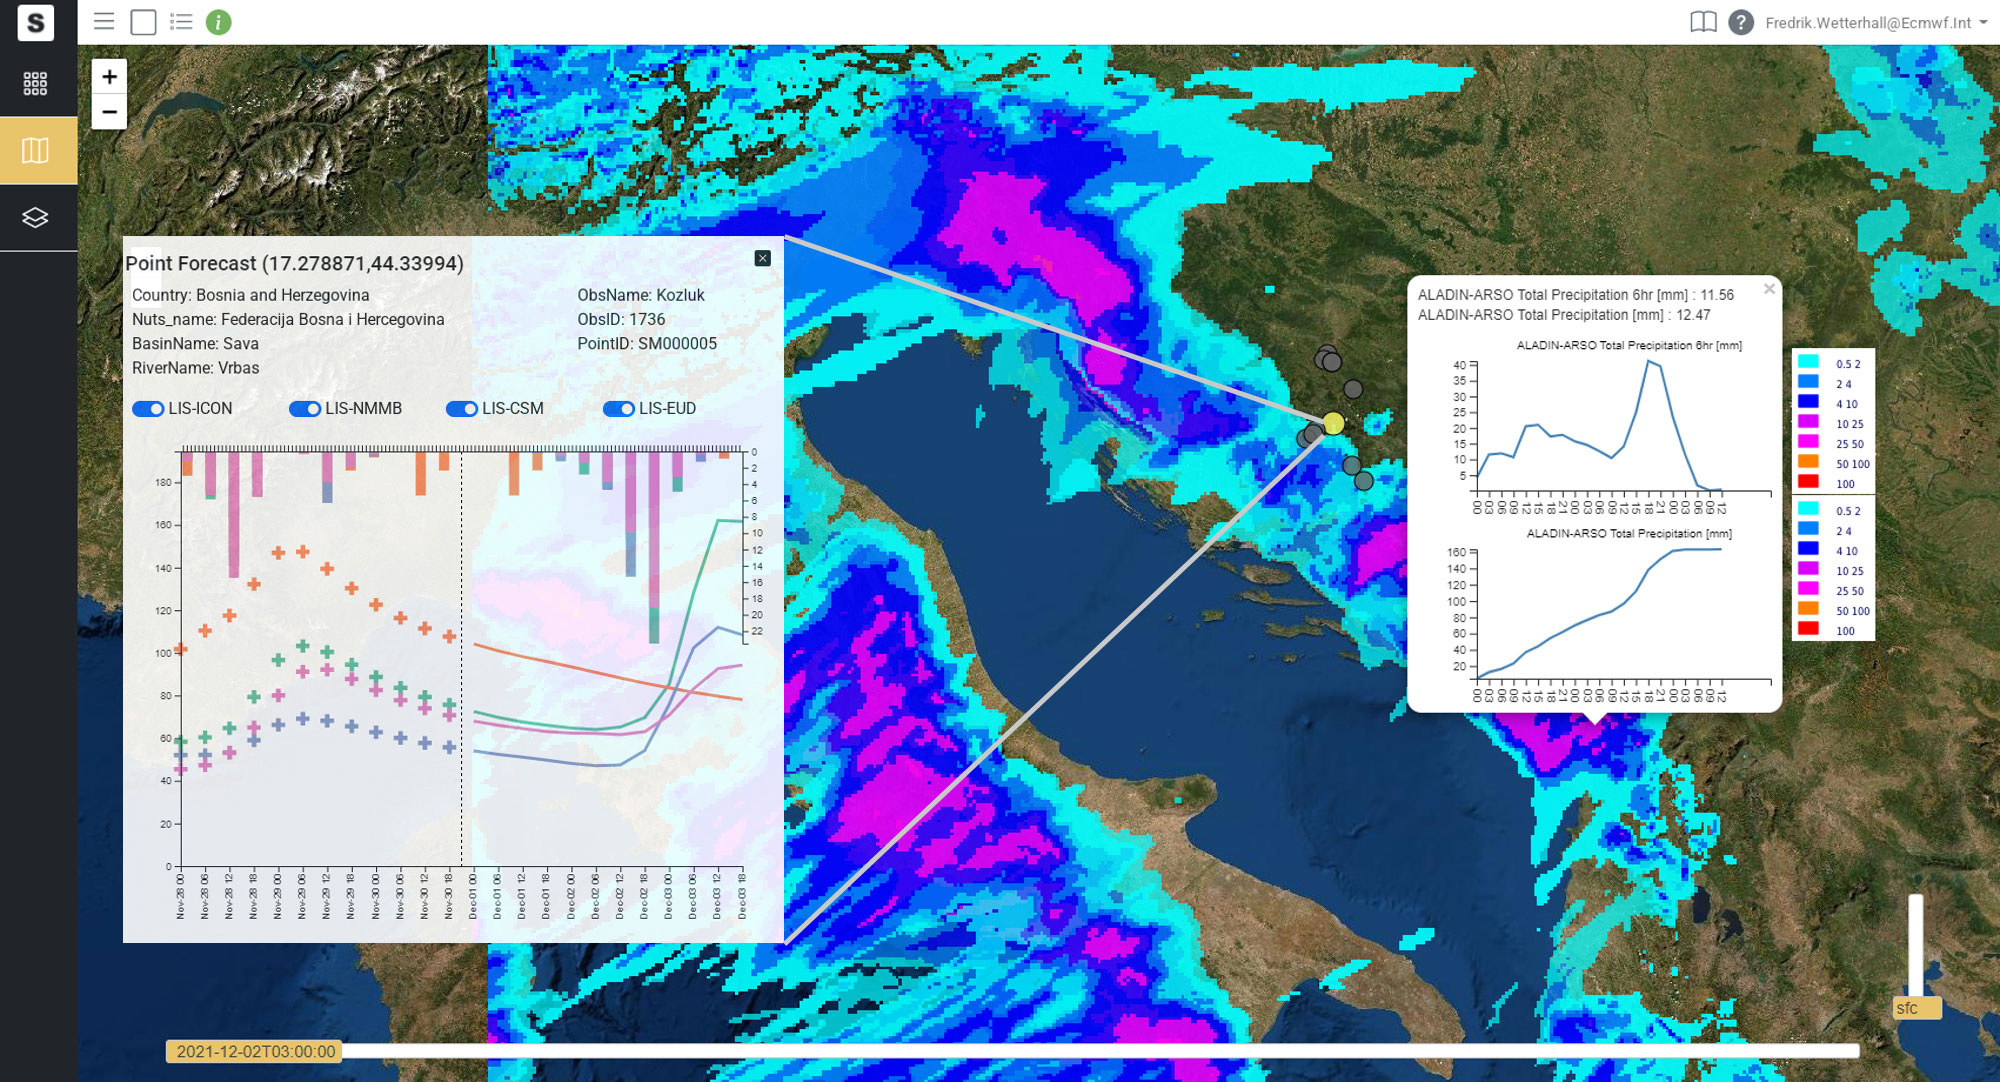
The SEE-MHEWS-A CIP consists of four components: a user interface (Figure 6), an image server, a database, and an intermediary element between users and the resources they intend to obtain (REST API).
A prototype was developed and implemented on the European Weather Cloud (EWC) using Kubernetes (k8s) as a cluster solution. A virtual server has also been installed within the cloud environment to provide Network File System (NFS) server functionality. The whole application is based on Django apps and hosts a catalogue of available products, a viewer, and a dashboard to monitor points of interest. The application also deals with user management, such as user registration, verification and authorisation. The solution for the product generation in the CIP depends on the product. For NWP products, GRIB files are converted to web map services (WMS). For other products, such as hydrological reporting points and river discharge exceedance, the hydrological modelling chain creates images and xml files which are then converted to a web service at the CIP backend. This is done using Mapserver and a set of endpoint services made available through the Django REST API app.
The main technologies used in the CIP for visualising data are following Open Geospatial Consortium (OGC) standards. The technologies used are enabling interaction with the user, and plots can be adjusted on the fly. Several user interaction events, including dedicated workshops, were held to understand the needs of users to ensure that the prototype is fit for purpose.
Conclusions and lessons learned
The use of the additional observations brought by SEE-MHEWS-A in ECMWF data assimilation is benefiting all of our Member and Co-operating States through the provision of improved initial and lateral boundary conditions. The additional observations are also used by the data assimilation part of the ALADIN contribution to SEE-MHEWS-A and the INCA Nowcasting system. A subset of them, targeting a specific area, will be used by the hydrological components. In January 2021, the SEE-MHEWS-A Project Steering Group agreed to share these additional observations with WMO Global Data-processing and Forecasting System centres, starting with the World Meteorological Centre DWD Offenbach.
The experience gained in the acquisition and processing of additional observations not shared via the GTS is proving useful and beneficial in the recently established EUMETNET Federated Data Coordination Mechanism (FDCM) programme.
The benefits for ECMWF and its Member and Cooperating States can be summarised as follows:
- The development of the pilot SEE-MHEWS‑A system strengthens the early warning capacity in the region for the benefit of all national meteorological and hydrological services (NMHS) participating in the project.
- ECMWF has intensified its collaboration with several NMHS.
- There is increased visibility in other forums related to observational exchange (e.g. EUMETNET Supplementary Data Hub, other WMO activities).
- ECMWF has potential opportunities to convince countries in the region of the benefits of joining as Co-operating States.
- Additional observational data (especially temperature and precipitation) become available from stations in the region.
- The use of SAPP is improved, including at the Turkish Meteorological Service for its own data assimilation and the provision of observations to ECMWF as part of the project.
- The Member State share of HPCF resources is more fully used due to several NWP suites running at ECMWF, including time-critical ones.
- The project allows the testing of new technologies in web services as part of the development of the CIP.
The SEE-MHEWS-A project has been successfully implemented by the different participating countries, with ECMWF support. The various components of the workflow have been implemented in the most suitable ECMWF facility and re-using ECMWF software and systems such as ECPDS, SAPP, and ecFlow. The project has demonstrated how a fairly complex Member and Co-operating State application can be developed and operated using all services available to ECMWF countries.
The third and final phase of the project, the implementation of a fully operational system, is planned to start in 2022. The project has proven to deliver a system that provides good output, but there is still a lot of work to do to make it a fully fit-for-purpose system for forecasters, especially regarding the development of a decision support tool that will meet forecasters’ demands.
Acknowledgements
The implementation has been made possible through the interaction of several NMHS in ECMWF Member and Co-operating States. The project is led by Milan Dacic and Sari Lappi from the WMO (https://public.wmo.int/en/projects/see-mhews-a) and is supported by the World Bank, the U.S. Agency for International Development/The Office of U.S. Foreign Disaster Assistance (USAID/OFDA), the European Union and the Global Facility for Disaster Reduction and Recovery (GFDRR). From ECMWF, in addition to the authors of this article, Volkan Firat, Christopher Barnard, Cinzia Mazzetti, Damien Decremer, Francesca Moschini and Xavier Abellan were involved.
Further reading
Haiden, T., A. Kann, C. Wittmann, G. Pistotnik, B. Bica, & C. Gruber, 2011: The Integrated Nowcasting through Comprehensive Analysis (INCA) System and Its Validation over the Eastern Alpine Region, Weather and Forecasting, 26(2), 166–183. doi.org/10.1175/2010WAF2222451.1
Smith, P.J., F. Pappenberger, F. Wetterhall, J. Thielen Del Pozo, B. Krzeminski, P. Salamon et al., 2016: On the Operational Implementation of the European Flood Awareness System (EFAS), in: Flood Forecasting: A Global Perspective, Academic Press, 313–348. doi.org/10.1016/B978-0-12- 801884-2.00011-6