
On 5 November 2019, the Global Flood Awareness System (GloFAS) was upgraded to version 2.1. The upgrade includes the release of a revised global hydrological reanalysis based on ECMWF’s ERA5 atmospheric, land surface and ocean wave reanalysis. The GloFAS reanalysis is freely and openly available to users through the Copernicus Climate Change Service (C3S) Climate Data Store. The upgrade also introduced a new set of river discharge re-forecasts and revised flood thresholds. In addition, new global flood risk assessment products (summary flood extent and flood impact overview), flood summary maps and ancillary web products have been developed to help users to interpret GloFAS forecasts. GloFAS is the flood component of the Copernicus Emergency Management Service (CEMS) Early Warning Service, for which ECMWF is the computational centre. For more details on GloFAS, see Box A.
River discharge reanalysis
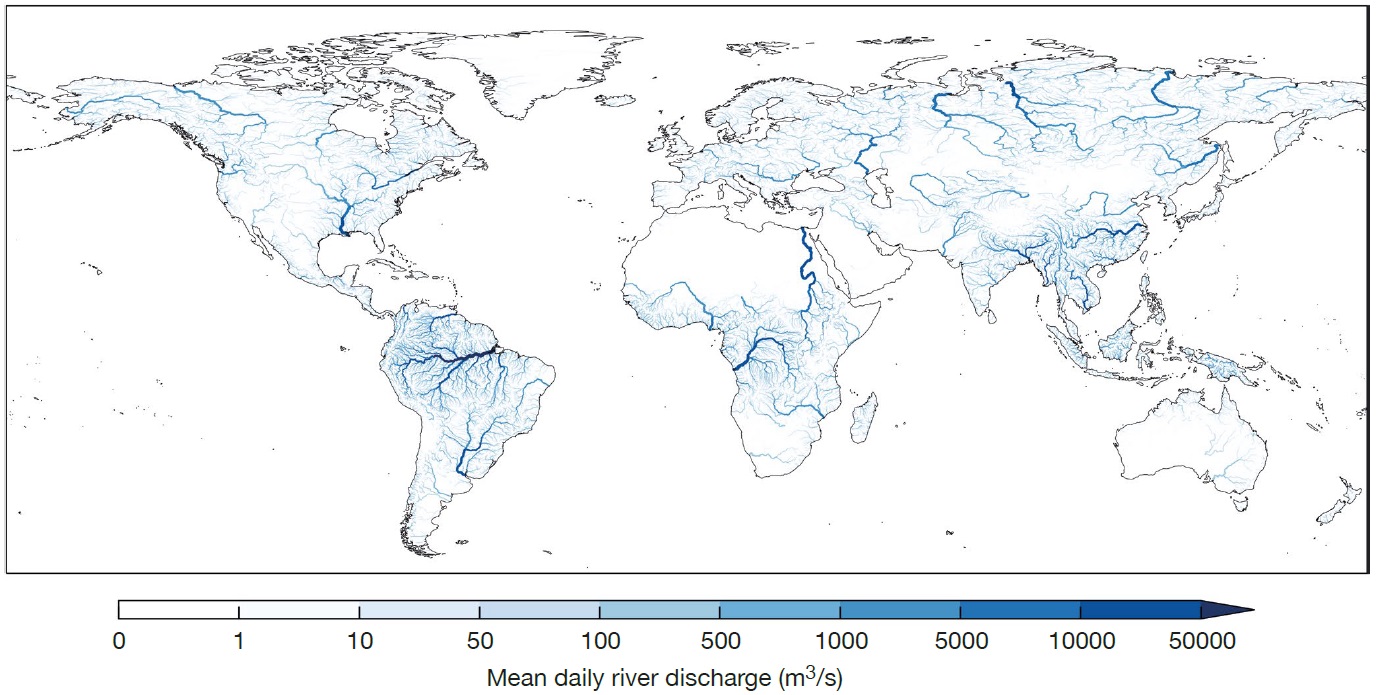
The GloFAS river discharge reanalysis has been updated based on ERA5 data from 1979 to the present (Figure 1). On 5 November 2019, the river discharge reanalysis was made available to the wider community through the C3S Climate Data Store. The reanalysis covers the entire globe and provides information for every day of the last 40 years. GloFAS‐ERA5 contains two streams: a quality‐assured component, updated monthly with a 2–3‐month latency, using the quality‐checked and officially released, consolidated ERA5 data, and a more timely component (GloFAST) based on timely ERA5 data (ERA5T). GloFAST is provided daily with an expected latency of two to five days behind real time. The GloFAS‐ERA5 river discharge reanalysis will be an invaluable resource to monitor river discharge in near real time anywhere in the world and to understand variability and changes in hydrological conditions. This is especially important for regions where no or few in‐situ observations are available. More details are available in Harrigan et al. (2020).
A
What is GloFAS?
The Global Flood Awareness System (GloFAS) is a forecasting service which aims to provide transboundary early flood guidance over every medium to large river basin in the world, helping national hydro‐meteorological services, humanitarian agencies and commercial companies to improve their response to flood‐ related hazards. GloFAS products are delivered through an interactive web service. GloFAS has been developed in close cooperation between the European Commission’s Joint Research Centre (JRC) and ECMWF, with support from humanitarian agencies, national authorities and research institutions, such as the Red Cross and the University of Reading. GloFAS couples ECMWF’s ensemble weather forecasts with the HTESSEL land surface model (the land surface component of ECMWF’s Integrated Forecasting System) to produce surface and subsurface runoff, and the LISFLOOD hydrological model (developed at the JRC) to route the runoff into and through the river network. GloFAS has a 30‐day component (GloFAS 30‐day), which has produced probabilistic flood forecasts up to 30 days ahead semi‐operationally since 2011, and a seasonal hydrological outlook system (GloFAS Seasonal), which has provided high‐ and low‐flow anomalies up to 16 weeks ahead since November 2017. GloFAS officially became part of the Copernicus Emergency Management Service (CEMS) in April 2018, since when it has been offering a fully operational, 24/7 service.
New re-forecasts and thresholds
New river discharge re‐forecasts have been produced covering the period 1998 to 2019 for the ‘GloFAS 30‐day’ product and 1981 to 2017 for the ‘GloFAS Seasonal’ product. Simulations have been performed for a set of past dates using the same model that is used in the real‐time forecasts. The re‐forecasts have been initialised from the quality‐assured component of the GloFAS‐ERA5 river discharge reanalysis. These river discharge re‐forecasts provide a long, homogeneous forecast time series, ideal for GloFAS forecast evaluation.
The return period flood thresholds were updated in GloFAS 30‐day using the GloFAS‐ERA5 river discharge reanalysis over the period 1979–2018, while in GloFAS Seasonal the low‐ and high‐flow thresholds were updated using the new seasonal re‐forecasts for the period 1981–2017. In addition, there was a small change in the computational methodology for the return period thresholds used in GloFAS 30‐day.
Rapid flood risk assessment
GloFAS now includes two global flood impact products: a rapid flood mapping layer and a rapid impact assessment layer (Figure 2). These two products are among the first globally operational products to link streamflow forecasts to predicted inundation area and impact. They are still regarded as experimental and may evolve over the next few months following user feedback.

The rapid flood mapping layer provides an overview of the estimated flood inundation footprint in river 2 basins with an upstream area larger than 5,000 km . Following the methodology already used in the European Flood Awareness System (EFAS), the footprint is defined based on the maximum return period threshold exceeded by the ensemble mean river discharge forecast over the next 30 days. It is extracted from a catalogue of maps for flood events of 10, 20, 50, 100, 200 and 500‐year return period magnitudes, pre‐generated by the LISFLOOD‐FP hydraulic model at a resolution of 0.00833 degrees (corresponding to a grid spacing of about 1 km).
The rapid impact assessment layer shows the potential flood impact on the population and land use, based on the inundated area in the rapid flood mapping layer. Population data is taken from the European Commission’s Global Human Settlement Layer (GHSL), and land cover data is taken from the European Space Agency – Climate Change Initiative (ESA‐CCI) land cover map series. The total population and areas of land which are exposed to flood hazards are aggregated by administrative region sourced from the Global Administrative Areas database (GADM) and the EU’s NUTS (Nomenclature of Territorial Units for Statistics) database in Europe. In the rapid impact assessment layer, the global administrative regions are shaded according to an impact matrix which combines the total population exposure to the flood hazard with the lead time of the flood event. Categories along the top of the matrix refer to the total number of people who live within the flood inundation footprint. If no people live within the footprint, then the rapid impact assessment product is not calculated in that administrative region. The lead time refers to the earliest time of the GloFAS river discharge peak within a given administrative region. Highest impact categories are defined when the flood peak is expected within 3 days, with at least 1,000 people potentially affected by the flood footprint, or for events potentially impacting more than 10,000 people in the next 10 days.
Flood summary maps
Previously, the GloFAS 30‐day product summarised flood forecasts in terms of the highest probability across the 30‐day forecast horizon for discharge levels to exceed 5‐ and 20‐year return period thresholds. This meant it was difficult for users to identify the timing of the predicted flood wave and its severity across time.
To facilitate a quick diagnostic, a new flood summary map has now been introduced, which combines information on the probability of exceeding all three GloFAS thresholds into a single summary product (Figure 3). It is provided for three forecast periods: short‐range (days 1–3), medium‐range (days 4–10), and extended‐range (days 11–30) forecasts. This product is available for all rivers with an upstream area larger than 1,000 km2. The layers show where the maximum of the ensemble mean river discharge (ENS‐max) in the respective forecast periods exceeds the 20‐year return period threshold (purple); where ENS‐max is between the 5‐ and 20‐year thresholds (red); or where it is between the 2‐ and 5‐year thresholds (dark yellow). In addition, if the probability of exceeding the 2‐year return period threshold is greater than 20% (but the ENS‐max does not reach the threshold), the river network is coloured in light yellow.

Ancillary maps
Finally, to help users interpret the forecast information provided on the GloFAS website, the following ancillary web products have been added (Figure 3):
- The upstream area map shows the catchment area of the GloFAS river network in blue (the darker the colour, the larger the catchment area) for all river basins of more than 1,000 km2.
- The reservoir impact map shows the potential impact of reservoirs included in GloFAS on river discharge at the global scale. It is given as the ratio of reservoir volume to mean annual river discharge at each river pixel.
- The major rivers map shows the major rivers of the world along with their name.
- The administrative regions map shows the areas used in the new global rapid flood risk assessment product, defined using the NUTS‐2 or NUTS‐3 classification from EUROSTAT and the region classification from GADM.
Conclusion
This GloFAS upgrade has introduced a range of new products designed to support flood risk assessments at the global level. These include a new global reanalysis of river discharge updated two to five days behind real time, and a range of new products to facilitate flood impact assessments. User feedback on the new products is welcome. More details on the upgrade are available on the GloFAS website (www. globalfloods.eu) and on a dedicated ECMWF wiki page (https://confluence.ecmwf.int/display/COPSRV/ GloFAS+v2.1).
Further reading
Harrigan, S., E. Zsoter, L. Alfieri, C. Prudhomme, P. Salamon, F. Wetterhall, C. Barnard, H. Cloke, F. Pappenberger, 2020: GloFAS‐ERA5 operational global river discharge reanalysis 1979‐present, Earth Syst. Sci. Data Discuss., doi: 10.5194/essd‐2019‐232, under review.