
“Without data, you’re just another person with an opinion.” This statement, which is often attributed to the late US engineer and statistician W. Edwards Deming, is no doubt valid in many contexts. Here we set out how machine data generated at ECMWF can help to provide insights that are valuable to the Centre’s services.
What are machine data?
Machine data are logs generated by the activity of computers, websites, security systems, networks, smartphones, smart cars etc. They are underused but very valuable as they contain important hidden information. Areas in which they can be useful include: monitoring and troubleshooting, root‐cause analysis, performance analysis, security, business analytics, marketing insights, user behaviour and customer support.
Machine data are one of the fastest‐growing kinds of big data. Relational databases and traditional methods/software cannot manage these voluminous amounts of data very effectively. As a result, more sophisticated technologies specifically designed for machine logs have emerged and enable organisations to gain new insights from previously inaccessible or untapped data. Moreover, the application of artificial intelligence and machine learning techniques to machine log analytics can help companies to automate some processes and to move from a reactive to a predictive approach in operations.
At ECMWF, one of the main systems that produce large amounts of machine data is MARS, the Centre’s Meteorological Archival and Retrieval System. MARS enables users to access ECMWF’s meteorological data, e.g. operational forecasts, meteorological observations, reanalyses and many public datasets. Users can access this managed archive from any computer at ECMWF as well as remotely via a web‐based application programming interface (Web‐API). In a typical day, MARS processes 1.5 million user requests and delivers 400 TB of data.
Analysing the data
MARS and the Web‐API produce massive amounts of multi‐structured logs on a daily basis, spread out over several systems. Collecting and storing this diverse range of data in a common platform would enable us to analyse the logs more effectively and gain new insights into the entire service.
Two years ago, we decided to work on a proof‐of‐ concept based on Splunk, a log management platform for ingesting, searching, monitoring, and analysing machine logs. Splunk, which had already been used at ECMWF since 2015, can be used to produce interactive tools, reports, alerts, visualisations etc. Initially we worked on historical data to produce relevant reports and statistics (Figure 1). We then started to address more day‐to‐day operational challenges by analysing near‐real‐ time logs (Figure 2). Since then, we have extended the use of Splunk to a wider set of logs and we have automated the logging of different kinds of activity. Some benefits and use cases are presented below.


Operational monitoring and troubleshooting
Speed matters in operational services. By collecting, ingesting and processing live streams of logs in near real time from several systems, we can detect issues, raise alarms early, take immediate action and monitor the health of the operational services more proactively.
We can combine aggregations of different logs in a single dashboard and correlate patterns across several components in one place. This enables us to have a better overview in near real time.
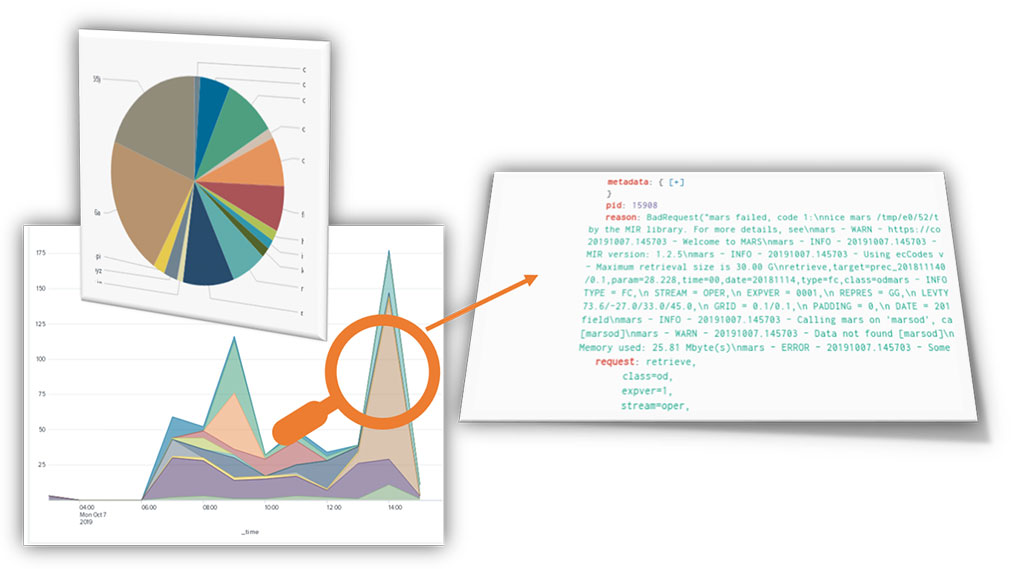
Through a series of interactive customised dashboards, we can drill down to further investigate an issue (Figures 3 and 4). We can then view associated logs and related charts, isolate and investigate specific problems and identify anomalies. Previously, it used to take a significant amount of time to collect and analyse this type of information as it had to be gathered from files stored across different systems.


A more data-driven approach
We are developing objective analytics based on historical data to gain smarter insights, obtain optimal answers and make better decisions and plans. For example, we use objective criteria to evaluate the performance of our services using thresholds (Figure 5). These can then be used for purposes such as finding components that are causing poor user experience and managing the lifetime of obsolete datasets. Such objective analysis capabilities have enabled us to identify which datasets are going to be essential to maintain during the migration to our new data centre in Bologna.

Communication and collaboration
Sharing our logs within ECMWF has enabled us to better collaborate between teams, and to ensure that we are all measuring the same activity. This helps us to improve our communication and to share insights and knowledge more efficiently. To support the interpretation of the information, we are also developing dashboards customised to the specific needs of different teams (Figure 6).

Improving DevOps
The project has given us an opportunity to try new ideas that help us to improve our DevOps practices (i.e. practices in which software development and IT operations go hand in hand). One such improvement is the use of tools that enable us to make faster and better decisions about the quality of new Web‐API releases. Using a set of dashboards, we can analyse the voluminous logs produced during stress tests, detect any quality or performance issues on new software releases and fix them before the software is deployed in production (Figure 7).
Conclusions
We have built a proof‐of‐concept to address the need for a centralised management system for the machine data generated by some of our services. This project is enabling near‐real‐time monitoring and troubleshooting for the Web‐API and it is improving operational visibility across the MARS service. Moreover, it is fostering a more data‐driven approach to decision‐making and improving communication and collaboration with other teams.
We believe that overall this project has been very successful. It has shown promising results and it has highlighted the importance of a well‐defined log management strategy for the effective operation of complex systems.
Looking ahead, we plan to:
FIGURE 7 A new Web-API release can be checked using interactive bespoke tools that enable us to detect any underlying issues and investigate further.
- transition this proof‐of‐concept towards operations
- explore applying the ideas to other services
- investigate artificial intelligence and machine learning concepts and their application to machine data processing
- work to further improve the observability of our services.
Useful links
MARS user documentation: https://confluence.ecmwf.int/display/UDOC/MARS+user+documentation
ECMWF’s Web‐API: https://confluence.ecmwf.int/display/WEBAPI
Using Splunk to analyse machine data: https://www.splunk.com/en_us/resources/machine-data.html