For the last few years, an automatic data checking system has been used at ECMWF to monitor the quality and availability of observations processed by ECMWF’s data assimilation system (Dahoui et al., 2020). The tool is playing an important role in flagging up observation issues and enabling the timely triggering of mitigating actions. The system is performing well and has a good detection efficiency. However, its behaviour is less optimal when assigning a severity level to detected events. The statistical procedure used to assign the severity requires tuning, and the behaviour is different from one kind of observation quantity to another. As a result, occasionally less significant events can be communicated as considerable or severe. When the day-to-day variability is small, moderate changes can be interpreted as severe from a statistical point of view. Given that not every threshold violation is a problem, there is a need for an improved way of inferring severity.
Another weakness of the current system is its inability to consider warnings affecting individual data types in the context of what is happening with the rest of the observing system and the type of weather activity dominating in the affected areas. Most anomaly detection tests are based on first-guess departures, i.e. the differences between a short-range forecast and observations. In these, uncertainties from observations and the short-range forecast are combined, which means that the generated warnings are not necessarily caused by observation problems. Factors causing the statistics to deviate are diverse. They require novel methods to attribute the cause and decide on the relevance of the detected event.
Machine learning techniques offer the possibility to improve the anomaly detection via a better detection of patterns, and to improve the classification of events by severity and cause. They do not need a periodic adjustment of threshold limits, either, which makes them useful for the monitoring of satellite data from a growing number of satellite platforms. As part of a wider movement at ECMWF to use machine learning operationally (see Düben et al., 2021), a new version of the automatic data checking system has been designed. It is based on an unsupervised recurrent neural network algorithm for the detection of abnormal statistics, and on a supervised learning algorithm (random forest) to classify the detected events. The automatic checking of observations is mainly used internally at ECMWF, but severe notifications are shared with selected users from EUMETSAT and the Numerical Weather Prediction Satellite Application Facility (NWP SAF) consortium. Improving the severity assignment will ensure delivered warnings are reliable. The new automatic detection framework is planned to be implemented operationally in 2023 after further testing.
In this article, we describe the design and technical implementation of the new system and how it aims to address the limitations of the current operational framework. Avenues for evolving the system are also presented.
Design of the machine learning observational data checking system
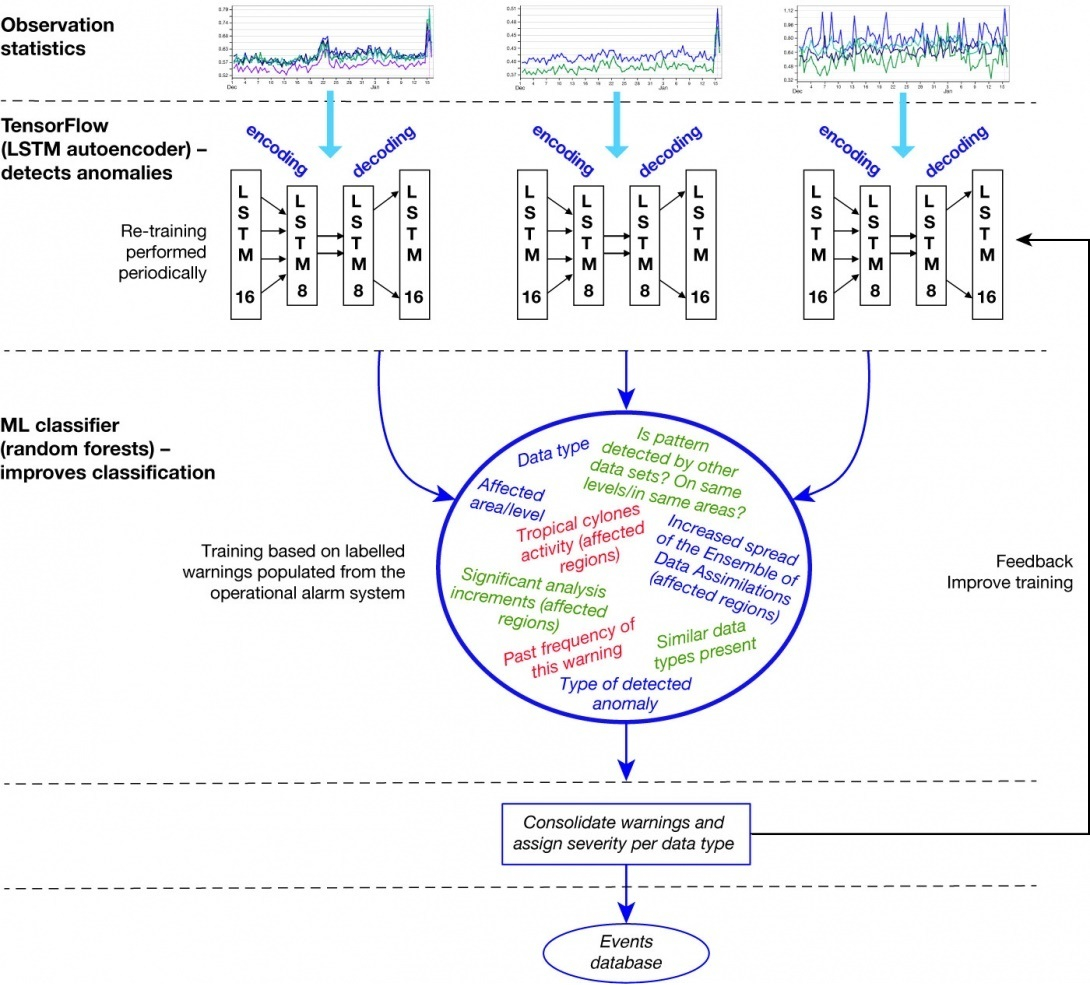
The machine learning version of the observational data checking system (Figure 1) has inherited many aspects of the current operational framework, in particular the statistics pre-processing, a set of static plausibility checks, the ignore facility, and the delivery of warnings to subscribed users. The anomaly detection module has been completely modified to rely on an unsupervised neural network algorithm to detect large deviations of statistics. This module aims to flag up sudden changes and slow drifts of statistics. The anomaly detection is performed separately for all observation types. The combined results are analysed by a supervised machine learning classifier (random forest) to adjust the severity (including a dismissal of the event), indicate the likely cause, and suggest whether action is needed. The classification results are then processed for each individual data type in order to generate relevant plots and archive warnings in an event database.
Unsupervised detection of observation anomalies
Two neural network models are applied to each individual data group to learn from the short-term behaviour (past three months) and the long-term evolution (past 12 months when available). The neural networks are autoencoders with long short-term memory (LSTM) cells. The choice of LSTM is mainly intended to enable multi-feature analysis, which is useful to scale up the system in order to support large amounts of data.
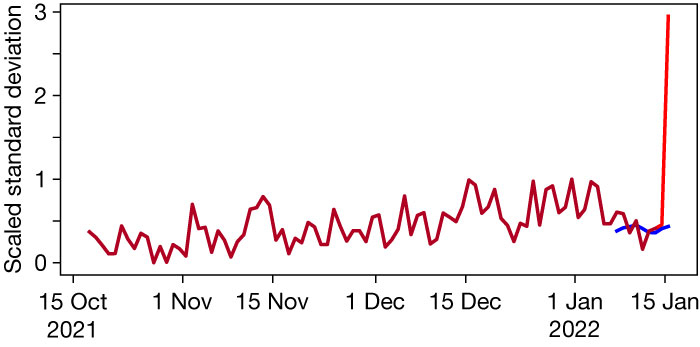
The short-term model is trained every data assimilation cycle using recent statistics and excluding the last two days. The training dataset contains only statistics that are considered to be ‘normal’. Previously detected events and outliers are excluded. As part of the training, we determine the resulting reconstruction error, which is conservatively chosen as the upper tail of the calculated loss in the training set. The trained model is then applied to the latest data sample (spanning the last few days) to reconstruct/predict the current statistics. The comparison of the neural network model and actual statistics will be larger than the reconstruction error when abnormal statistics are encountered (Figure 2). Statistics that are provided as input to the short-term model must be scaled typically between 0 and 1 based on minimum/maximum values. The scaling is necessary to ensure a better convergence of the neural network training. Some observation quantities need to be adjusted to remove periodic signals in order to avoid interpreting ups and downs as abnormal signals. For short-term models, a periodicity removal is necessary for satellite data counts due to periodic dips in counts caused by orbital movements or routines operations. For long-term models, it is important to remove seasonal periodic signals affecting random errors of departures and bias correction.
The number of training epochs is set high to ensure convergence. However, an early stopping mechanism is used to avoid overfitting and reduce the training time.
The aim of the long-term trained model is to detect a slow drift of statistics. The model is trained once every quarter using the past 12 months of statistics (if available). To speed up the training and smoothen day-to-day variability, the data are sampled over periods of ten days. As part of the training, we determine the resulting reconstruction error, which is chosen as the upper tail of the calculated loss in the training set. The trained model is then applied to the latest data sample (spanning the last few weeks sampled every 10 days) to reconstruct the current statistics. Large differences between reconstructed statistics and observed ones indicate a significant change compared to long-term behaviour. Such a change can take the form of a step change (due to a model upgrade) or a slow drift of the observation quantity being monitored. The main interest is to detect a slow drift of statistics. This is achieved thanks to a monotonic slope detection algorithm applied to cases flagged up by the neural network. If the slope is not monotonic, the event is discarded.
The distribution of both neural network reconstruction errors is used to define an initial estimation of the event severity, by deriving a Z score. The classification module will adjust or consolidate these attributes.
The data checking is applied separately to individual data groups. The grouping represents the desired granularity of observation quantities to be checked. For satellite data, a group represents an observation quantity (such as the standard deviation of observations minus first-guess forecast) from a specific channel (or a pressure layer) over a specific geographical area. For some satellite data, additional dimensions are considered, such as the orbital mode (ascending/descending orbits), phase (for GNSS Radio Occultation measurements), or wind type (for atmospheric motion vectors). For in‑situ data, the data groups are similar to satellite data for area-based statistics. In addition to area-based statistics, the data checking is monitoring observation quantities for each individual station, leading to a large number of items to check. The training of neural networks is fast for each data group, but when done sequentially for all items (for each observation type), the training can be very time-consuming. The LSTM ability to use multi-features enables a more efficient way of performing the training. Each data group (such as the data count from channel 16 from the IASI instrument on EUMETSAT’s Metop‑B satellite over the tropics) is considered to be a feature. A multi-feature vector is constructed from a large number of data groups. Such a structure enables the training to be done efficiently at once for a multitude of groups. Although features are considered together, the neural network can learn the behaviour of each data group. This enables the possibility to detect anomalies affecting one data group and not any other. The multi-feature vector is nevertheless constructed from data groups that are likely to be correlated (e.g. because they originated from the same satellite or from surface stations in the same country), which enables the detection of events affecting the whole group.
The use of neural networks to detect anomalies without the need for periodic adjustment of threshold limits is important to efficiently monitor the evolving number of satellite data. Data providers are planning to fly constellations of small satellites to provide weather data. This is expected to significantly increase the number of satellite platforms to monitor. In‑situ data are also expected to increase in number and diversify due to the emergence of crowdsourced data and the inclusion of national second-tier observations.
Supervised classification of detected anomalies
Once the anomaly detection has been performed separately for all data types, all detected events are grouped together in a warnings basket. Each event is then augmented by a list of additional features reflecting common events from other data types, significant weather conditions, and the number of past occurrences of the event. A machine learning classifier (random forest) is then applied to define attributes of the detected warnings. These include false alarm (yes/no), slight event (yes/no), considerable event (yes/no), severe event (yes/no), cause (data/other) and action required (yes/no). The machine learning classifier has been trained using a population of previously generated warnings from the current operational system. The training set has been labelled to define the target attributes. Through the training process, the system is expected to learn the rules that lead to labelling decisions based on event attributes (see Figure 3).
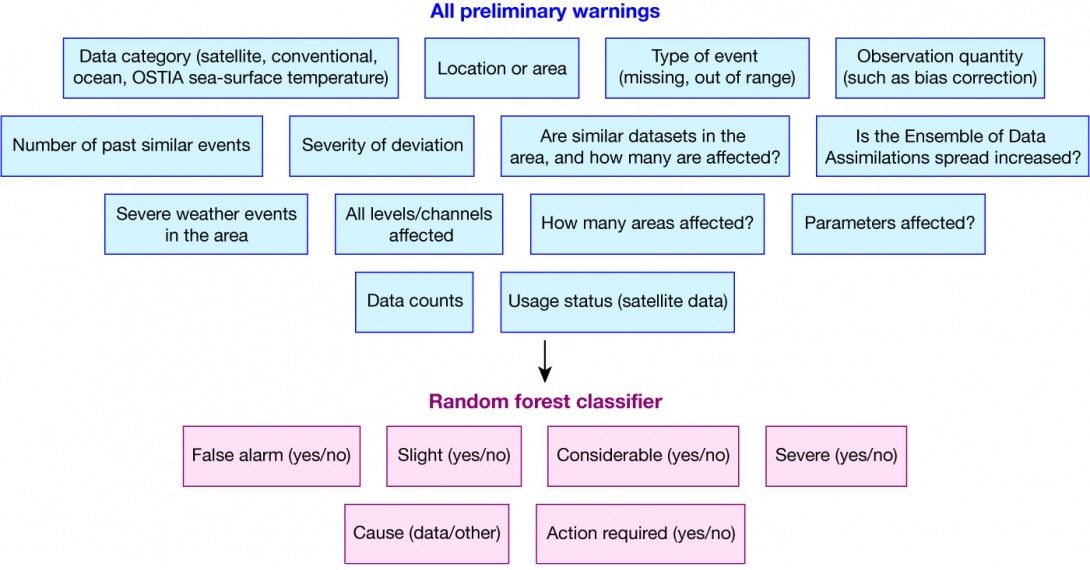
These rules (in the form of decision trees) are then applied to warnings to label them. The training dataset needs to be pre-processed for each target attribute to enable the balancing of the population of possible outcomes. The balancing simply involves the duplication of items for the less populated categories.
The labelling process is time-consuming and requires domain knowledge. In this first implementation, the labelling process was mostly done semi-automatically involving some rules gained from the experience of using the data checking system. The performance of the classification depends largely on the quality of the labelling of the training dataset and more importantly on the data features selected to characterise an event.
Figure 3 shows the important features used by the classifier to determine the cause of events. Once the system is operationally implemented, we plan to repeat the training procedure based on a more refined manual labelling and to allow ad‑hoc labelling of generated warnings when relevant (in case of unusual events, for instance). Improving the labelling is very important to improve the reliability of the data checking system.
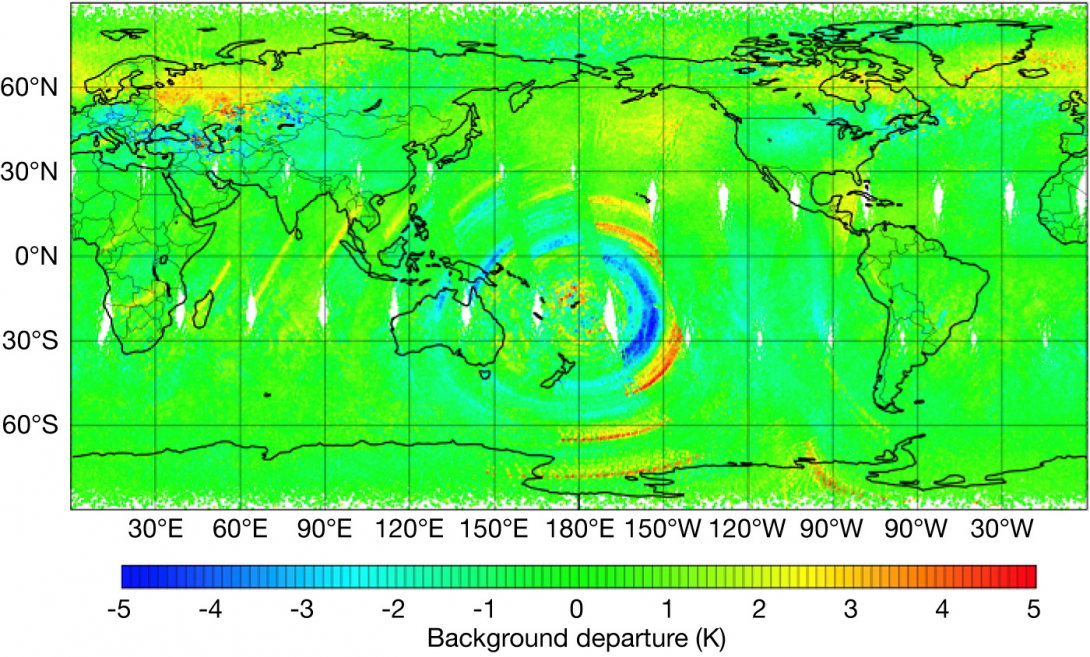
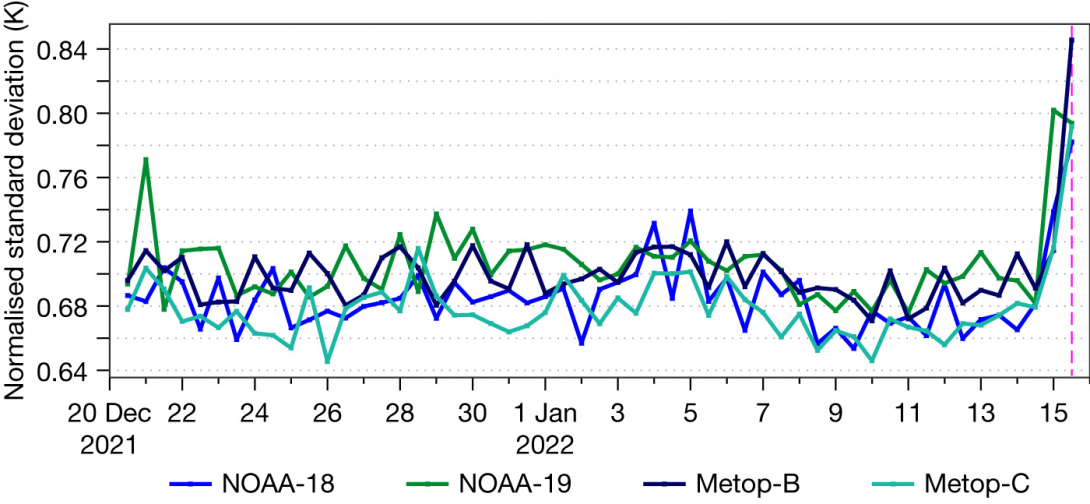
Once the classification of detected events has been achieved, a consolidation step is performed for each data type. This involves merging common events to reduce the number of warnings communicated to users; generating time series of warnings; and archiving warnings in the event database. An example of consolidated events are warnings triggered for many satellite data as a result of the shockwave associated with the Hunga Tonga–Hunga Ha’apai eruption in mid-January 2022 (Figures 4 and 5). The cause of the warnings was attributed to other causes (volcano eruption in this case) by the automatic data checking system. The classification was mainly driven by the number of independent data sources affected by the same event.
Evolution of the machine learning data checking system
This first implementation of the machine learning data checking system aims to incorporate novel techniques in the detection of observation anomalies. The new system tends to have fewer false alarms than the current operational framework, and it is able to detect all relevant anomalies and to assign appropriate severity levels. The random forest classifier manages to consider each warning in the context of what is happening with the other components of the observing system. This leads to a better distinction between observation anomalies and issues caused by other factors, such as data assimilation limitations and unusual atmospheric activities. However, the current classifier is mostly reproducing rules used during the semi-automatic labelling of the training dataset. Improved labelling will greatly benefit classification and severity assignment. Future upgrades will offer the possibility to continuously evolve the training dataset by enabling ad‑hoc labelling of interesting events. The training of classifiers will also benefit from simulated scenarios for hacking and data tampering that might affect parts of the observing system. This will enable the system to issue warnings if such scenarios materialise in the future.
Automatic data checking is currently performed after data assimilation takes place, which means that corrective actions are applied at a later stage. ECMWF is planning to implement automatic data checking of incoming data before the start of data assimilation. The detection results will potentially contribute to automatic data selection. A machine-learning-based system is well placed to perform pre-assimilation checks thanks to its reduced reliance on manual tuning and the possibility of improvement due to improved labelling. Parallel efforts are being pursued at ECMWF to use machine learning within the forecasting system to improve data selection and quality control, for example relating to machine-learning-based cloud detection for infrared satellite data.
Further reading
Dahoui, M., N. Bormann, L. Isaksen & T. McNally, 2020: Recent developments in the automatic checking of Earth system observations, ECMWF Newsletter No. 162, 27–31.
Düben, P., U. Modigliani, A. Geer, S. Siemen, F. Pappenberger, P. Bauer et al.: 2021, Machine learning at ECMWF: A roadmap for the next 10 years, Technical Memorandum No. 878.
