
During the COVID-19 pandemic in 2020, ECMWF was offered free access to commercial Global Navigation Satellite System Radio Occultation (GNSS-RO) data from Spire Global (Spire in the following). This offer was to partially mitigate the loss of aircraft observations. Without having a chance to test the impact of Spire data in detail, the data was assimilated operationally from 13 May to 30 September 2020, about five weeks after the initial Spire offer. Even before COVID-19 hit the globe, plans were already in the making to perform a detailed investigation of the impact of the assimilation of Spire data into ECMWF’s Integrated Forecasting System (IFS) and the UK Met Office system. On 1 July 2020, a project funded by the European Space Agency (ESA) and conducted at ECMWF, the UK Met Office and EUMETSAT started to study exactly this.
The ESA-funded study investigated the impact of assimilating GNSS-RO data from COSMIC-2 and from Spire in both the ECMWF and UK Met Office systems. The project analysed what effect the addition of Spire as well as COSMIC-2 data has by running a series of observing system experiments (OSEs). In addition, ECMWF ran corresponding Ensemble of Data Assimilations (EDA) experiments to investigate the relationship between EDA spread estimates and the OSE short-range forecast error statistics. In particular, these EDA-OSE comparisons enabled us to test previous results obtained with simulated GNSS-RO observations, which suggested that large increases in the GNSS-RO observation numbers would be beneficial. The main finding is that the assimilation of COSMIC-2 and Spire data leads to improvements in medium-range and short-range forecasts. Hence, both ECMWF and the UK Met Office could assimilate Spire data operationally if they were available. We found reasonably good agreement between the EDA spread and the OSE error statistics, suggesting that the EDA technique is a useful method for assessing future observing systems.
What is GNSS-RO?
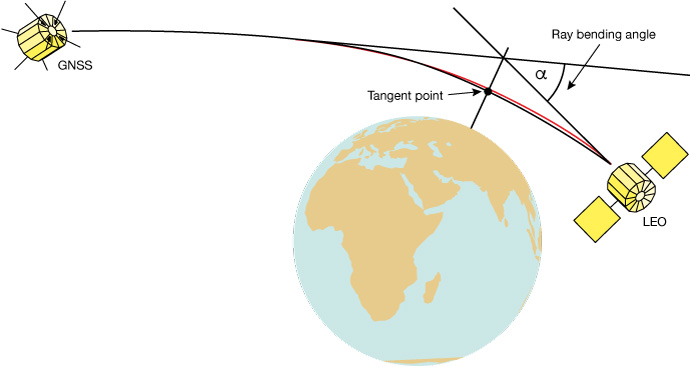
GNSS-RO is an active satellite measurement technique, where signals from GPS (Global Positioning System) and other GNSS (global navigation satellite systems) are used to retrieve temperature and humidity profile information. Radio occultation (RO) was pioneered in the 1960s. In 1965, the Mariner-4 mission used RO to provide the first measurements of the atmosphere of Mars. The technique is still used by planetary scientists today. The GNSS-RO observations we assimilate at ECMWF use a satellite-to-satellite geometry (see Figure 1). Atmospheric properties like temperature and humidity modify the extent to which the path of the GNSS signal between the satellites is bent. From this bending angle, it is possible to retrieve information about these variables. Measurements using this technique have been assimilated at ECMWF since 2006.
Spire and COSMIC-2 data
Spire satellites have a nominal lifetime of 2+ years and new satellites are launched regularly, with updated hardware (Masters et al., 2019). For example, newer satellites have larger solar panels and two occultation antennas allowing the simultaneous collection of both rising and setting occultations. Spire develops the satellites and the GNSS receiver as well as operating a network of 30+ ground stations which provide support, e.g. for data downlinks.
COSMIC-2 (Constellation Observing System for Meteorology, Ionosphere & Climate – 2) is a follow-up mission from COSMIC-1, which was very successful. The cluster of six satellites was launched on 25 June 2019 and spreads along different low-inclination orbits. The main aim of this mission is to perform temperature and humidity soundings as well as making a substantial contribution to space weather applications.
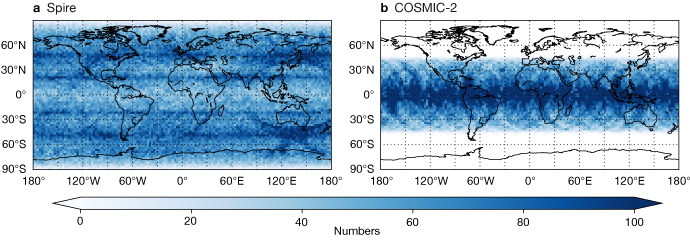
For this study, we received around 5,000 RO profiles from Spire per day globally, and for COSMIC-2 around 4,000 RO profiles per day in a latitude band between ±40 degrees (see Figure 2).
Observing system experiments
Since late 2020, we have run various observing system experiments (OSEs) at ECMWF and the UK Met Office, testing the additional assimilation of Spire and COSMIC-2 (and other GNSS-RO) data into our respective four-dimensional variational (4D-Var) data assimilation systems. The ECMWF experiments use IFS Cycle 47r1 (operational on 30 June 2020), while the UK Met Office uses the setup from parallel suite 43 (operational on 4 December 2019). The experiments ran from 1 January to 31 March 2020, assimilating level-1b bending angle data. The chosen horizontal resolution for the ECMWF experiments is about 25 km (TCo399) and for the UK Met Office experiments about 40 km in the mid-latitudes (N320, 640x480 points on a regular latitude–longitude grid). The experiments are compared to a CONTROL one, which assimilates all observations used operationally for the experimental period. This includes the GNSS-RO data available before COSMIC-2 and Spire.
The experiments carried out in addition to the CONTROL one are:
- COSMIC2: This is the CONTROL experiment plus COSMIC-2 data
- Spire: This is the CONTROL experiment plus Spire data (only performed by ECMWF)
- Spire+COSMIC2: This is the CONTROL experiment plus both Spire and COSMIC-2 data
- noRO: This is the CONTROL experiment, but all GNSS-RO has been removed.
Due to numerous differences between the two numerical weather prediction (NWP) systems, we expect to see some differences in the impact of GNSS-RO observations. Some of the principal differences between the NWP systems are:
- The forecasting models are formulated differently. The ECMWF model is based on spherical harmonics, whereas the UK Met Office model uses a finite difference scheme on a regular latitude–longitude grid.
- The resolution of the modelling systems is different, with more than a factor of two in the horizontal resolution.
- There are large differences in the data assimilation systems. The ECMWF system uses a 12‑hour assimilation window, whereas the UK Met Office system uses a 6‑hour window.
- The forward operator used to model bending angles and the weight given to GNSS-RO observations are different (Bowler 2020a).
Results from OSEs
The addition of COSMIC-2 and Spire observations is beneficial in both the ECMWF and UK Met Office systems, with adding Spire on top of COSMIC-2 showing further improvements for some variables and some geographical areas. The largest impact we see from the addition of COSMIC-2 and Spire data can be seen at higher altitudes, which is not surprising as the core region of RO measurements is between heights of 8 km and 30 km. Figure 3 shows how the forecast scores improve with the addition of Spire and COSMIC-2 data compared to CONTROL for temperature at 100 hPa (about 16 km in a standard atmosphere) at ECMWF. Especially in the tropics, the addition of Spire and COSMIC-2 data significantly improves temperature forecast scores between day 1 and 4.

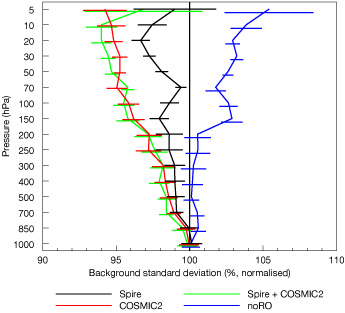
In general, improved medium-range forecast scores and improvement in short-range forecasts can be seen for temperature, humidity and wind, but with different magnitudes in the UK Met Office (not shown) and ECMWF systems. For example, fits to radiosonde temperature observations show improvements of about 5% at 100 hPa when adding Spire and COSMIC-2 for ECMWF in the tropics relative to CONTROL (see Figure 4). Fits to independent observations using the UK Met Office system show generally bigger improvements. For example, in the tropics the addition of Spire and COSMIC‑2 show an improvement of about 15% for the UK Met Office and 12% for ECMWF compared to noRO in the case mentioned above. The reasons why these differences occur are manifold, but they depend largely on how much skill the assimilation system already has before assimilating additional radio occultation data.
As a result of the addition of Spire and COSMIC-2, ECMWF and the UK Met Office show the largest positive impact in temperature for medium-range forecast scores in the southern hemisphere. For humidity, the biggest impact can be seen with the addition of COSMIC-2 in the tropics at ECMWF, as shown in Figure 5a for the Advanced Technology Microwave Sounder (ATMS) humidity channels 18 to 22. Furthermore, the positive impact for wind when adding Spire and COSMIC-2 could be seen in medium-range forecast scores for both the UK Met Office and ECMWF, with the latter showing this improvement in the short-range, too. For example, the largest improvements in short-range forecast fit to Aeolus data can be seen in the high troposphere and stratosphere (Figure 5b). It is also interesting to note that the additional data by Spire and COSMIC-2 improve the short-range forecast at the same or larger scale as the removal of the other GNSS-RO data degrades it. In fact, the improvements in fits to the humidity-sensitive channels of ATMS are much larger when Spire and COSMIC-2 (Spire, COSMIC2, Spire+COSMIC2) are assimilated than the degradations when GNSS-RO data are removed (noRO). To a lesser extent, the same can also be said for some wind and temperature observations.

Ensemble of Data Assimilations experiments
For ECMWF, we also performed a set of Ensemble of Data Assimilations (EDA) experiments corresponding to the OSEs. The EDA configuration we used in this study consists of ten independent members of 4D-Var data assimilation systems, where observations (including soil moisture), sea-surface temperature, and model physics are perturbed. If those perturbations are correctly specified, the EDA will provide good estimates of analysis and short-range forecast error uncertainties. Harnisch et al. (2013) used the EDA spread values (standard deviation amongst ensemble members) to estimate how the impact of GNSS-RO data scales with the number of observations using simulated GNSS-RO data. More recent work by Bowler (2020b) assimilating Spire data shows some consistency with the Harnisch et al. (2013) scaling plots, but Bowler uses a combined root-mean-square error value averaged over meteorological variables and forecast range, so the quantities are not directly comparable and therefore further investigation is justified. In this study, we have investigated how the relationship between EDA spread and the forecast error statistics changes as the number of real GNSS-RO measurements assimilated increases.
For this reason, we have performed various EDA experiments adding Spire and COSMIC-2 data over about a month, excluding the first nine days because of spin-up. That means the results comprise data from 10 January to 10 February 2020. The following EDA experiments corresponding to the OSEs have been performed: CONTROL, COSMIC2, Spire, Spire+COSMIC2 and noRO. The horizontal model resolution of the EDA experiments is TCo399 using IFS Cycle 47r1 with 137 vertical levels and three inner loops at resolutions of TL95/TL159/TL255. Here we show spread values derived on pressure levels, truncated at spectral wavenumber 255 and gridded onto a reduced Gaussian grid. EDA spread values have been calculated for T+12h.
Results from EDA experiments
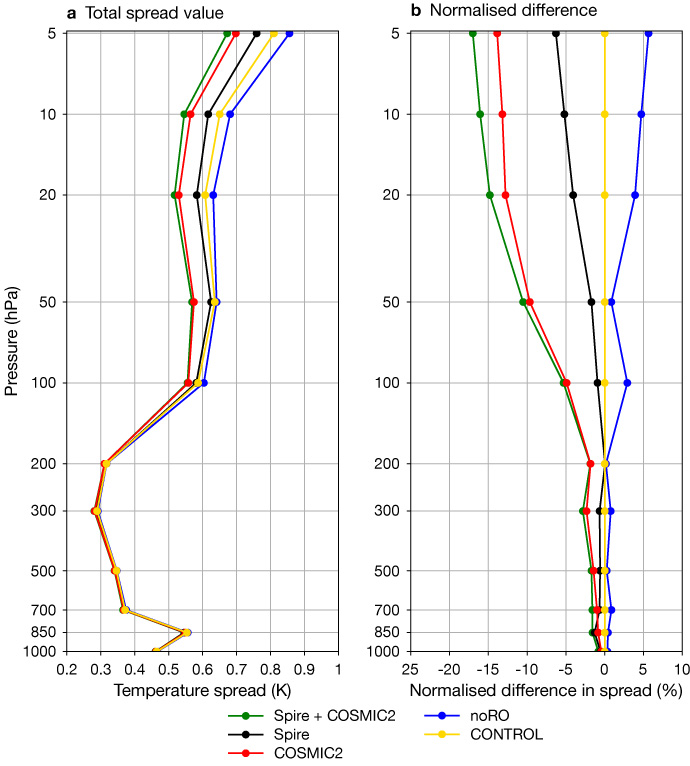
The vertical distribution of the EDA spread values for tropical temperature values are shown in Figure 6, with a decrease in EDA spread values with the addition of more GNSS-RO data. In particular, this is true for relatively high levels of 300 hPa (about 9 km) and higher, where the reduction in spread becomes larger with height. For example, at 10 hPa (about 31.5 km) the spread in the tropical temperature values is reduced by about 16% for Spire+COSMIC2 compared to the CONTROL experiment.
How the spread changes for temperature at 10 hPa and 100 hPa can be seen in more detail in Figures 7 and 8, which show the geographical distribution. The largest differences occur in the tropics, where most GNSS-RO is added compared to CONTROL. At 10 hPa, locally more than a 30% reduction in spread can be seen with the addition of Spire and COSMIC-2 data. Already at 100 hPa (see Figure 8), the reduction is more centred along the Intertropical Convergence Zone +/–20° but still reduced significantly by around 10% locally. Here, the larger spread values could be linked to the variability in height of the tropical tropopause layer in the austral summer. These results are in line with Harnisch et al. (2013), showing a systematic decrease in EDA spread values when more GNSS-RO data is added.


The next interesting question is how this decrease in EDA spread scales with the statistics of forecast errors from the corresponding OSEs. To evaluate forecast errors statistics, we use a forecast lead time of 12 hours and verify against the ECMWF operational analysis. Figure 9 shows the vertical distribution of EDA spread values for temperature in the tropics and the corresponding standard deviation of forecast errors for a setup with no GNSS-RO assimilated (noRO) and for Spire+COSMIC2, where all GNSS-RO data are assimilated. In general, the EDA spread in temperature behaves rather similarly to the standard deviation in forecast errors in the troposphere. Larger spread values are seen in the stratosphere (Figure 9a). In relative terms, the spread values and forecast errors decrease for Spire+COSMIC2 compared to noRO (Figure 9b), with a larger decrease for the EDA spread values. One aim of this study is to establish if there is a quantitative relationship between the two measures, as limitations in the EDA experiments and OSEs can have a profound impact on those numbers. In turns out that the relative change in EDA spread values goes in hand with a change in forecast errors when adding GNSS-RO data.

For short forecast lead times, e.g. T+12, the evaluation of forecast errors using analyses can be challenging. Here, the errors in the analysis and forecast can have comparable magnitudes and might be highly correlated (Bormann et al., 2019). This can be compensated by using observations as a reference, instead. For example, we can compare the EDA spread at a given height level with the corresponding departure statistics, using radiosonde data as a reference, for the set of experiments outlined above. The variance of the radiosonde minus forecast departures is the sum of the true forecast error and radiosonde measurement error variances. This suggests the EDA spread, as a measure of forecast error statistics, can be related to first-guess departures with the use of estimates of the radiosonde measurement errors (e.g. Desroziers et al., 2005).
An example of how the variance in first-guess departure statistics scales with the EDA variance when GNSS-RO data is added, for radiosonde temperature measurements at 100 hPa in the tropics, is shown in Figure 10a. Here, a linear relationship between the two measures can be seen, which means that a fixed decrease in EDA spread gives a fixed (but different magnitude) decrease in the variance of first-guess departures from the OSEs. However, this linear relationship cannot be seen in all geographical areas and altitudes. For example, it is not present in the northern hemisphere (Figure 10b). The reason why we see such behaviour is manifold. For example, the distribution of GNSS-RO data (the largest addition of GNSS-RO data is in the tropics), the location and number of radiosonde observations, and maybe the scales included in the shown truncated EDA values could be a reason for this behaviour.

Summary
In this study we ran different observing system experiments (OSEs) to investigate the impact of supplementary GNSS-RO data. The addition of Spire and COSMIC-2 data has a beneficial impact on forecast scores and fits with independent observations sensitive to humidity, temperature and wind. COSMIC-2 has been operationally assimilated since 25 March 2020, and Spire is planned to be assimilated operationally by early 2022.
Using EDA experiments to estimate the impact of new observations is still a rather new approach. We have tested it with GNSS-RO here, by comparing to results from OSEs. The reductions in EDA spread when adding Spire and COSMIC-2 data are largest in the stratosphere and are qualitatively consistent with reductions in OSE forecast error statistics. Also, results show that this is partially true when EDA statistics are evaluated against radiosonde observations. Hence, we think using EDA spread values is a good approach to assess future observing systems. That being said, none of these measures – EDA spread values, forecast errors from OSEs and fits to observations – are perfect for evaluating the added value obtained from the assimilation of additional GNSS-RO data. Despite their imperfection, one main signal stood out: the continuous addition of a high number of GNSS-RO occultations – Spire and COSMIC-2 data – brings added value to the forecasting system and is far away from reaching saturation point.
Further reading
Bormann, N., H. Lawrence & J. Farnan, 2019: Global observing system experiments in the ECMWF assimilation system, ECMWF Technical Memorandum, 839.
Bowler, N.E., 2020a: Revised GNSS‐RO observation uncertainties in the Met Office NWP system, Q. J. R. Meteorol. Soc., 146, 2274–2296.
Bowler, N.E., 2020b: An assessment of GNSS radio occultation data produced by Spire, Q. J. R. Meteorol. Soc., 146, 3772–3788.
Desroziers, G., L. Berre, B. Chapnik & P. Poli, 2005: Diagnosis of observation, background and analysis-error statistics in observation space, Q. J. R. Meteorol. Soc., 131, 3385–3396.
Harnisch, F., S.B. Healy, P. Bauer & S.J. English, 2013: Scaling of GNSS radio occultation impact with observation number using an ensemble of data assimilations, Mon. Wea. Rev., 141, 4395–4413.
Healy, P., 2020: ECMWF starts assimilating COSMIC-2 data, ECMWF Newsletter No. 163, 5–6.
Masters, D., V. Irisov, V. Nguyen, T. Duly, O. NoguésCorreig, L. Tan et al., 2019: Status and plans for Spire’s growing commercial constellation of GNSS science cubesats, presented at the EUMETSAT ROM SAF-IROWG International Workshop, Helsingør, Denmark, 19–25 September 2019.