The graphical web-based interface designed for the WIGOS (WMO Integrated Global Observing System) Data Quality Monitoring System (WDQMS) became fully operational on 17 March 2020, four months after its pre-operational release. The WDQMS web tool is a resource developed jointly by WMO and ECMWF to monitor the performance of all WIGOS observing components. This interactive tool aims to support the monitoring, evaluation and incident management activities of WDQMS, and it is part of WMO’s wider strategy to strengthen the surface-based components of WIGOS.
The new tool monitors the availability and quality of land-based surface and upper-air (radiosonde) observations, based on near-real-time monitoring information provided by the four participating global numerical weather prediction (NWP) centres: the German Weather Service (DWD), ECMWF, the Japan Meteorological Agency (JMA) and the US National Centers for Environmental Prediction (NCEP). The system collects 6-hourly quality monitoring reports from these four WIGOS Monitoring Centres, and it stores the data in the WDQMS database at ECMWF. The monitoring data is then aggregated, and the calculated statistics are compared against performance thresholds.
Availability and quality
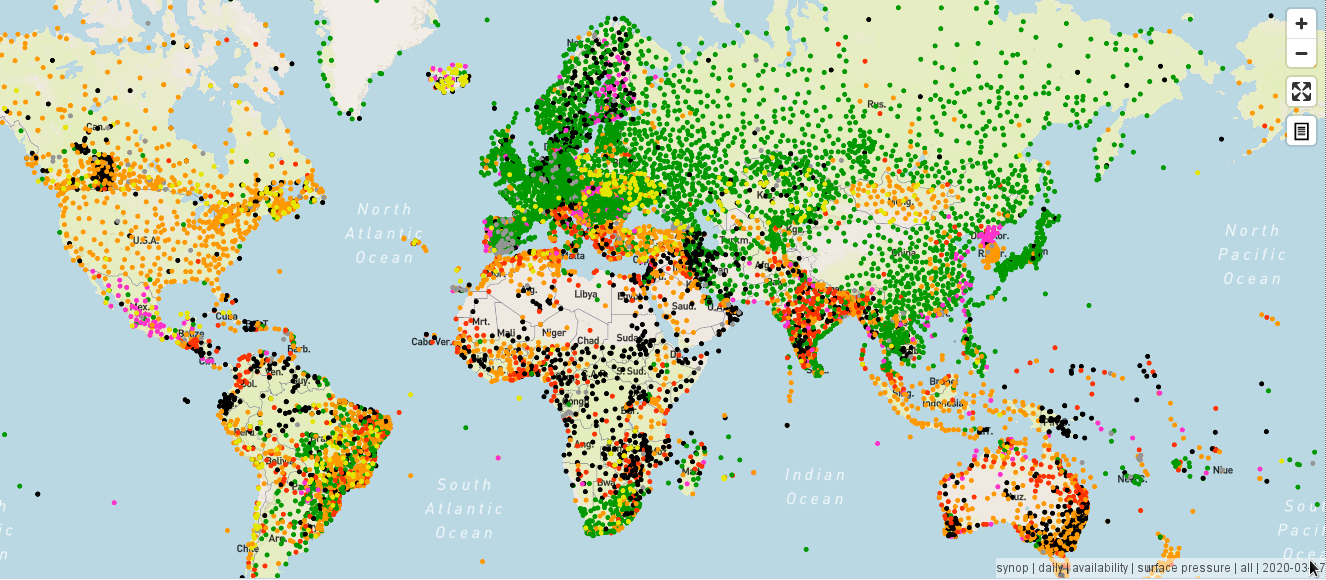
Availability information is obtained by comparing the number of observations received from the network (i.e. the observations that were made available to the assimilation system of each NWP centre) to those expected to be ingested into the WMO Information System (WIS), according to the schedule determined by the OSCAR/ Surface database, the global repository of WIGOS metadata for all surface-based observations. As illustrated by the figure, the system flags up discrepancies between what is scheduled and what is actually observed and highlights any issues.
The quality assessment is based on comparing computed statistics (e.g. bias and standard deviation) of Observation-minus-Background (O–B) departures, provided by the WIGOS Monitoring Centres, against the up-to-date observational requirements of global NWP defined in OSCAR/ Requirements. The monitoring is applied only to the observed quantities whose O–B departures are available in the NWP monitoring reports, i.e. the ones for which a background derived from the model forecast is available in the NWP assimilation systems. Therefore, the surface physical quantities monitored are the following: surface pressure (or geopotential height, for some land stations in mountainous areas), 2-metre temperature, 2-metre relative humidity and 10-metre wind (meridional and zonal components). For the upper-air land-based observations, the quantities are: air temperature, relative humidity and wind, both meridional and zonal components.
The role of Regional WIGOS Centres
The system aggregates the NWP monitoring information by station, time interval, observed variable and NWP Centre and generates availability and quality performance reports that are displayed as maps or time series. The temporal aggregation is presented in three different formats: 6-hourly intervals (from 00, 06, 12 and 18 UTC), daily, and monthly (not yet available).
In addition, results across NWP centres are aggregated. For this, the best data availability and quality result per station and variable is used to generate a combined performance report. Finally, an extra level of aggregation (Alert) based on 5-day moving averages across the WIGOS Monitoring Centres is also available to warn WMO Regional WIGOS Centres (RWC) about potential observational issues.
The RWCs are responsible for analysing the performance reports provided by the web tool and assessing whether any of the observational issues highlighted by the system should be formally raised as incidents with the data providers. They are also responsible for the management of WIGOS metadata at a regional level to support WMO Members in updating, maintaining and quality controlling station metadata in OSCAR/Surface. In practice, they will have to work closely with the data providers to resolve incidents with observational data and metadata in a timely manner. Therefore, the WDQMS web tool, with its direct link to OSCAR/ Surface, makes it possible to check in near real time (daily) the impact of any metadata update on the status of the observing network. It is also planned to record monitoring information from the WDQMS web tool in OSCAR/ Surface, so that essential information can flow between the two systems to ensure consistency.
Benefits
WDQMS and the new web tool have the potential to bring far-reaching benefits for WMO’s management of the surface- based component of WIGOS. The NWP community benefits not only from a better-performing network, but also from near-real-time access to comparable monitoring data from multiple global NWP centres. This can help NWP centres to disentangle observation errors from model errors and to compare their own data coverage and data quality with those of other NWP centres. National meteorological services will see increased usage of their observations due to improved quality, and they will receive feedback in near real time on the usage and quality of their observations.
Plans for the future include extending the monitoring to other components of WIGOS, such as climate-related observations, marine observations, aircraft observations, and others.
The ultimate goal of the WDQMS web tool is to monitor the performance of all observing platforms and stations documented in OSCAR/Surface in near real time in the case of weather observations and in delayed mode for climate observations.