

More than 40 people took part in person in Reading and up to 85 participated online at any one time in this year’s edition of Using ECMWF’s Forecasts (UEF2022), which ran from 7 to 10 June on the key theme of visualising meteorological data.
UEF2022 had a record number of registrations, with 450 people registering from 83 countries. “It was great to see so much interest in the event, and hopefully this has led to an increased awareness of what we do at ECMWF,” said Becky Hemingway, the event organiser.
The aim of UEF is to be a forum for exchanging ideas and experiences on the use of ECMWF data and products. “It was good to have in-person attendees in Reading again after two years of fully virtual events,” Becky said. “The in-person participants benefited from increased networking opportunities and interactive sessions.”
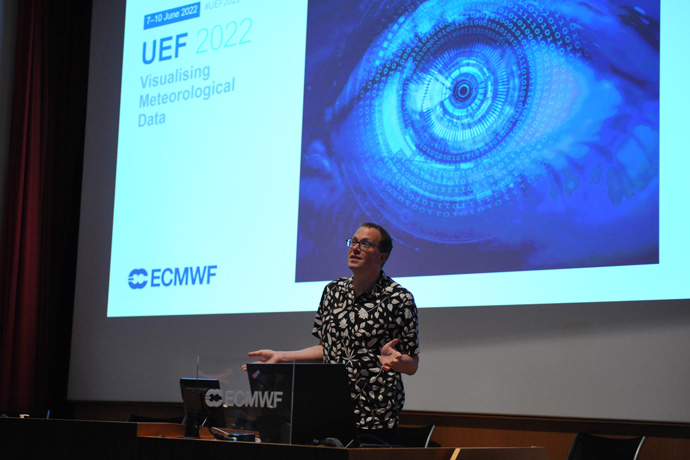
ECMWF Director of Forecasts Florian Pappenberger gave an introductory talk on ‘Forecasting for the future’.
Key messages
ECMWF staff presented updates to attendees covering operational, forecasting and research progress and plans.
Model Cycle 47r3 was shown to improve forecasts, including making precipitation more realistic due to an upgraded moist physics scheme.
Updates on ECMWF’s new Atos high-performance computing facility, the European Weather Cloud and Open Data were given. Plans for the EU’s Copernicus services run by ECMWF and for the EU’s Destination Earth initiative, which is partly implemented by ECMWF, were also presented.
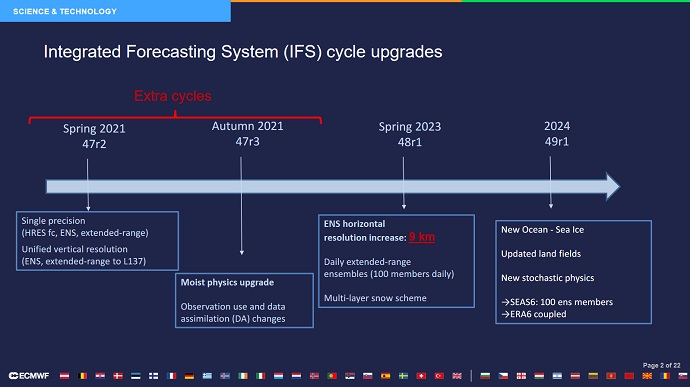
ECMWF Director of Research Andy Brown talked about ECMWF research progress and plans, including the next two model upgrades planned for 2023 and 2024.
A number of ECMWF product updates were highlighted, including ECMWF’s global ensemble post-processing scheme ecPoint; the use of weather regimes in extended-range predictions for Europe; and the ecCharts service to inspect and visualise ECMWF medium-range and extended-range data.
The theme of visualising meteorological data generated good discussions and ideas for future products and work. There were a number of extremely interesting presentations from all over the world on a variety of topics, most with an underlying theme of data visualisation and use.
Invited speakers included:
- Ed Hawkins from the University of Reading (UK) talking about his famous Climate Stripes (#showyourstripes)
- Neil Kay from the Met Office (UK) presenting several fun and exciting visualisations
- Angela Morelli from InfoDesignLab (Norway) talking about the process of designing graphics for the IPCC Summary for Policymakers
- Hayley Evers-King from EUMETSAT presenting on using Twitter as a communication tool; and
- Evelyn Cusack from Met Eireann (Ireland) talking about storm naming in the communication of forecasts.
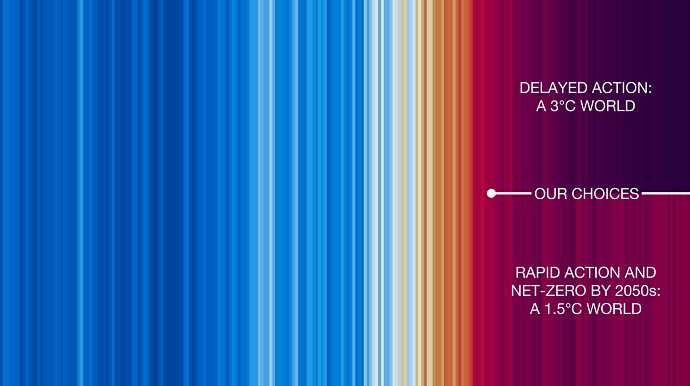
Ed Hawkins from the University of Reading spoke about ‘Visualising climate change’. He emphasised that it is important to convey the positive message that “the future is in our hands”.
Many presentations talked about the importance of effectively visualising data. A key point, mentioned in multiple presentations, was to start with the ‘intent’ of the visualisation, i.e. to establish the message of what you want to portray and then develop the visuals from there.
Posters and interactive visualisation
The poster session on Tuesday afternoon was well attended with good discussions and networking. The Weather Room at ECMWF had a nice ‘buzz’ about it with in-person attendees.
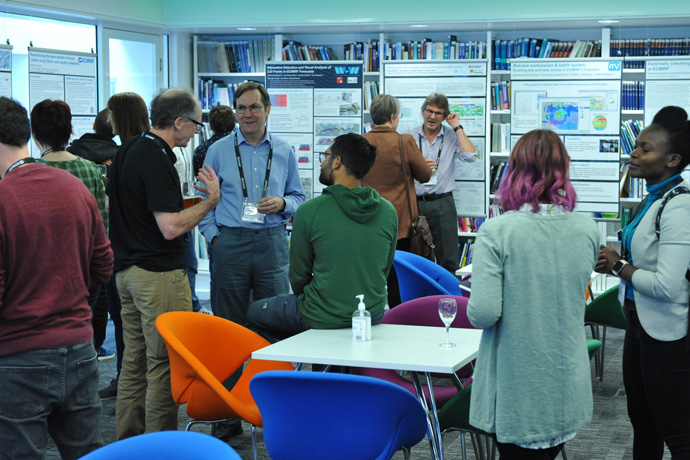
Poster sessions provided opportunities for informal discussions.
An interactive visualisation session on Thursday afternoon asked attendees to use what they had learned about data visualisation during UEF2022 to provide feedback on the visualisation of ECMWF products. Fifteen posters were hung around the weather room and attendees were invited to make comments on post-it notes about what could be improved and what they liked about the forecast visualisations.
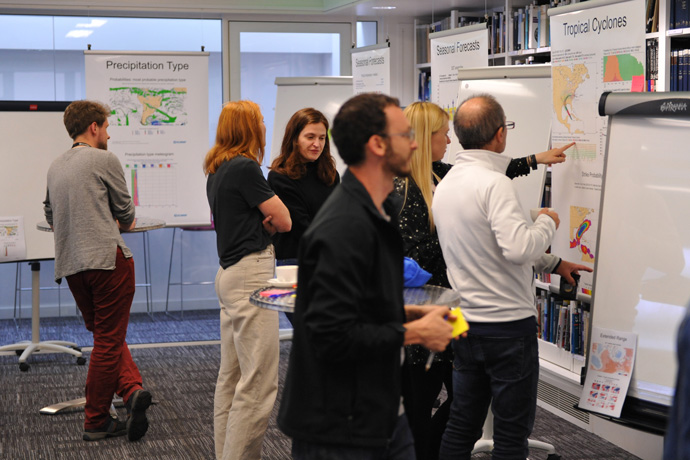
The interactive visualisation session showed different ways of visualising forecasts.
Further information
For more information, visit the UEF web page, which includes the slides and recordings of all presentations and some of the posters.
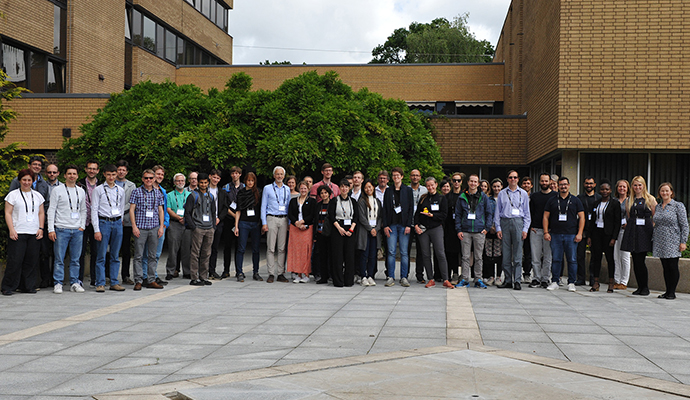
Attendance at UEF2022 was a mix of in-person and online.
