
Forecasts of atmospheric vertical profiles can assist with many forecasting challenges, such as predicting cloud layers, layers of instability and precipitation type. (Photo: SuriyaDesatit-Thinkstock-iStock)
ECMWF supports the national meteorological services of its Member and Co-operating States and other users by providing them with state-of-the-art global weather predictions.
A product launched in June in response to user requests makes it possible to visualise atmospheric conditions from the ground up to the lower stratosphere anywhere in the world.
It will help forecasters to assess the predicted state of the atmosphere and the potential for severe weather at any point on Earth.
Developing the product was not straightforward: considerable big data and visualisation challenges had to be overcome.
Data challenge
From the outset, it was clear that the product should be ensemble based. Ensemble forecasts show a range of possible outcomes and their respective probabilities. They enable forecasters to assess the confidence they can have in a forecast.
The challenge was thus to make available to a user, in a suitable graphical format, an ensemble of predictions that span the entire vertical extent of the troposphere, at relatively high resolution, for any point on Earth, within seconds of that user requesting it.
Judicious data choices had to be made: the model levels included in the product were thinned out at higher levels, and the lead time of forecasts was limited to five days.
The result is that vertical profile charts can be generated almost instantly to appear on the computer screen of a user within seconds.
Visualisation challenge
The second challenge was to invent suitable visualisations of the ensemble predictions for the full range of variables users might be interested in.
This was achieved by developing a multi-panel display which highlights different aspects of the atmospheric conditions.
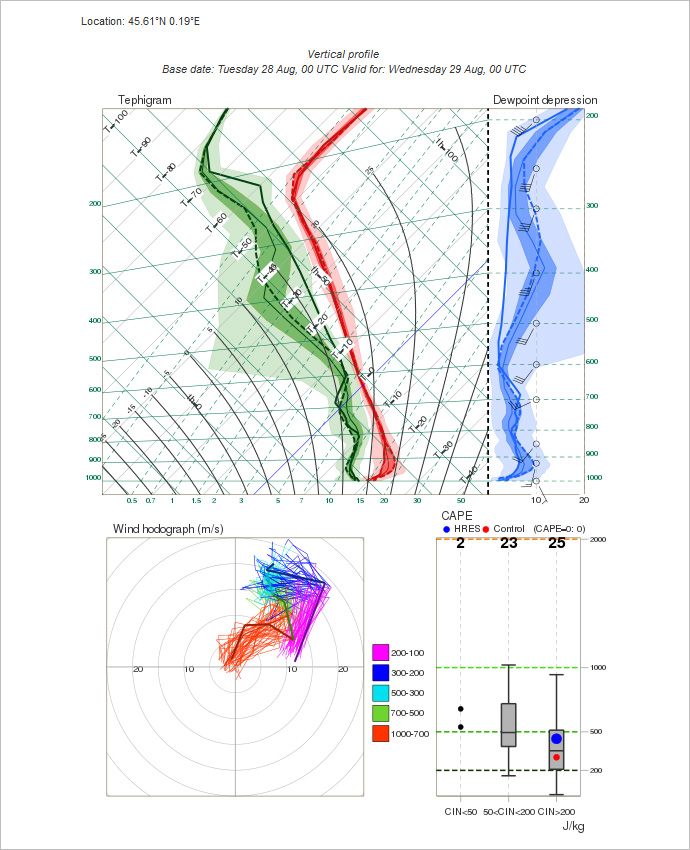
They include the key variables measured by radiosondes, namely temperature, dewpoint, wind speed and wind direction. A separate panel shows predicted convective available potential energy (CAPE) and convective inhibition (CIN) as these can give useful pointers related to certain types of severe weather.

The vertical profiles product includes several panels to show a thermodynamic diagram and dewpoint depression from both the ensemble and the high-resolution forecast (top); wind flags from the high-resolution forecast (top right); the vertical vector wind distribution using one line for each ensemble member and colours to indicate different pressure layers (bottom left); and the distributions of most unstable CAPE for three different categories of CIN (bottom right).
The new vertical profile product is available to licensed users in ecCharts.
For more information, see the ECMWF Newsletter article on the vertical profiles product and the ECMWF Forecast User Guide.
Please note that since the publication of the Newsletter article some minor improvements to the product have been made, such as a more helpful display of dewpoint depression, which is reflected in the figure above.
