

2017 started with a bang when ECMWF Copernicus reanalysis data showed that 2016 had been the warmest year on record.
The decision to build a new data centre in the Italian city of Bologna was of crucial importance for the future of the Centre.
Other milestones include a major model upgrade, the implementation of a new seasonal forecasting system and a series of successful workshops and training events.
2017 was also a year of anniversaries, including 25 years of ensemble forecasting and 20 years of 4D-Var data assimilation at the Centre.
Warmest year
2016 was the warmest year on record with global surface air temperatures about 1.3°C above pre-industrial levels, the Copernicus Climate Change Service (C3S) implemented by ECMWF on behalf of the EU announced at the beginning of January.
ECMWF data showed that 2016 was nearly 0.2°C warmer than the previous warmest year, 2015.
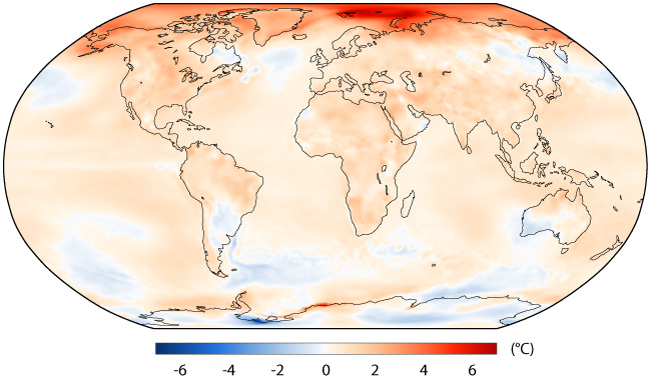
Air temperature at a height of two metres for 2016, shown relative to its 1981–2010 average. Source: Copernicus Climate Change Service, ECMWF.
In another C3S development, in July data going back to 2010 from a new powerful global climate monitoring dataset was released. Ultimately the ERA5 reanalysis will stretch back all the way to 1950.
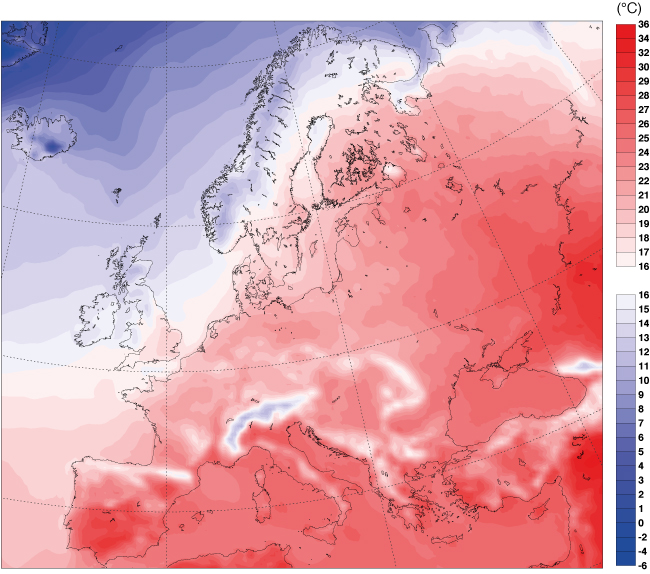
Daily mean surface air temperature in Europe in July 2010 from ERA5.
Data centre decision
On 22 June, ECMWF Member States approved the proposal by the Italian Government and the Emilia Romagna Region to host ECMWF’s new data centre in Bologna.
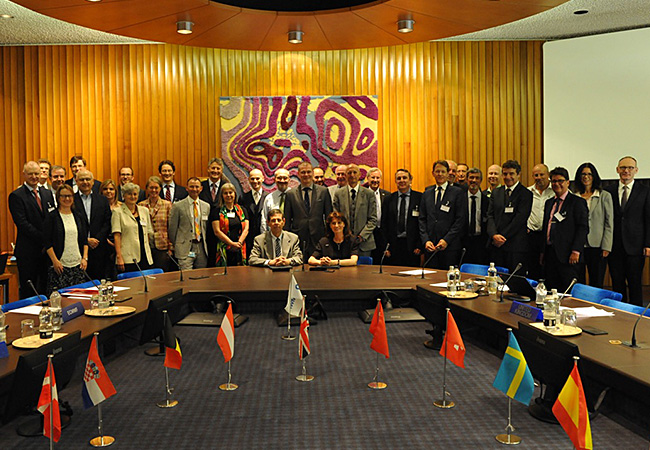
The Head of the Italian National Meteorological Service, Col. Silvio Cau, and ECMWF Director-General Florence Rabier (seated) signed the high-level agreement on the data centre in the presence of representatives from all 22 ECMWF Member States.
The move came after ECMWF's Council had mandated Director-General Florence Rabier to prepare a high-level agreement with the Italian Government.

The new data centre will be located in Bologna, Italy. (Image: gmp von Gerkan, Marg & Partner)
Model upgrades
An upgrade of ECMWF’s Integrated Forecasting System (IFS) implemented on 11 July improved forecast skill in medium-range and monthly forecasts.
IFS Cycle 43r3 included changes in the model and in the assimilation of weather observations.
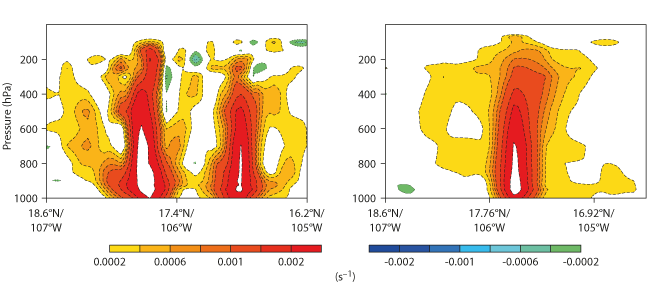
High-resolution analysis of relative vorticity (cross section) for Hurricane Patricia at 12 UTC on 23 October 2015 produced using the previous IFS cycle, 43r1 (left), and IFS Cycle 43r3 (right). The upgrade removed the unrealistic double-core structure.
In January, changes to the aerosol model of the Copernicus Atmosphere Monitoring Service (CAMS) global forecasting system operated by ECMWF resulted in more accurate forecasts. CAMS also added two new satellite datasets to the observations that help to define the initial state on which forecasts are based.
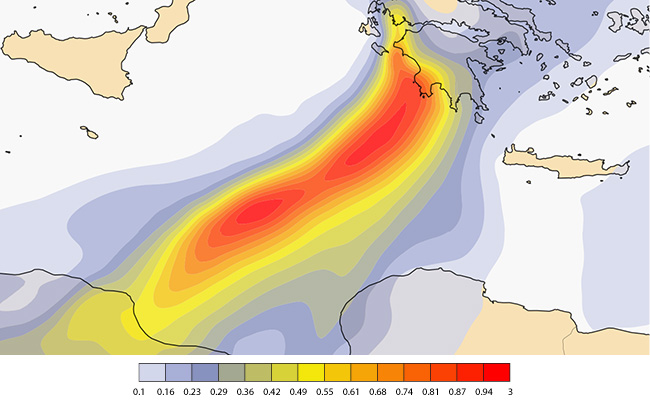
Forecast charts available on the CAMS website provide powerful zoom functionality and point-and-click features which enable detailed information for specific locations to be called up. This 36-hour forecast of Aerosol Optical Depth at 550 nm valid at 1200 UTC on 18 January 2017 reveals a dust plume stretching across the Mediterranean from northern Libya to southwestern Greece.
Seasonal forecasting
In November ECMWF launched a new seasonal prediction system (SEAS5) which brought better forecasts, especially for El Niño/La Niña events. Forecasts are also more detailed thanks to much greater horizontal resolution.
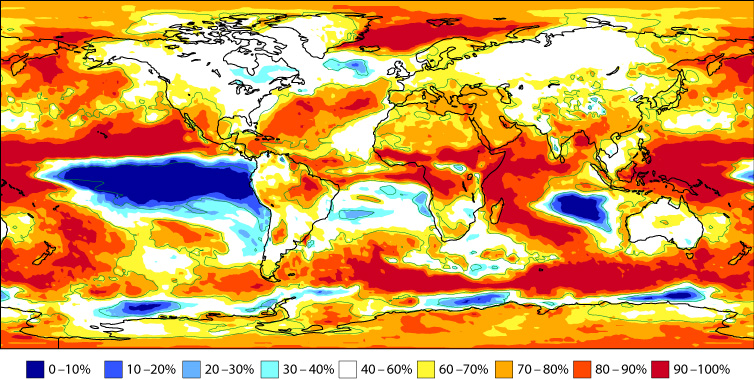
The plot shows the probability of 2-metre temperature being above the climatological median for December 2017 to February 2018, according to the first operational SEAS5 forecast. Past statistics suggest that the forecast is more reliable in some regions of the world, such as the eastern tropical Pacific and the Arctic, than in others. The yellow shading in parts of Europe signifies probabilities between 60 and 70%. Weak signals such as this imply a high degree of uncertainty.
Also in 2017, C3S trialled a multi-system seasonal forecast service bringing together forecasts from ECMWF, the UK Met Office and Météo-France.
Conferences, workshops, training events
Between 11 and 14 September more than 100 people from across the world joined ECMWF scientists and 28 speakers at the Annual Seminar on ‘Ensemble prediction: past, present and future’ to discuss how to further improve the accuracy and reliability of ensemble-based forecasts.
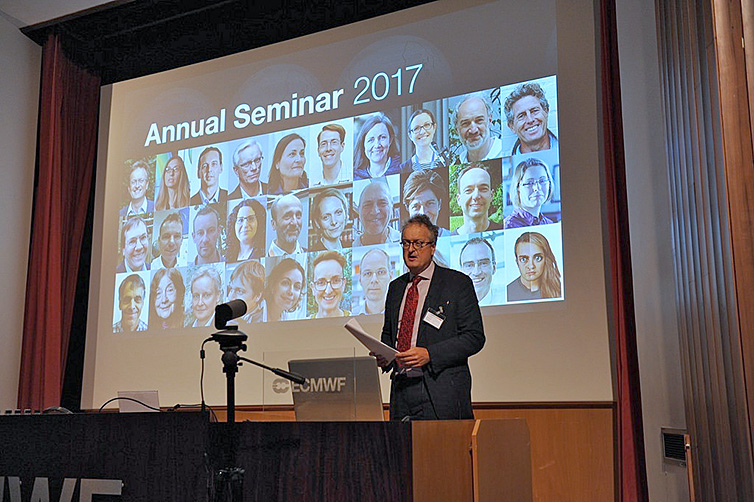
ECMWF Lead Scientist Roberto Buizza chaired the opening session of the Annual Seminar 2017.
Increasingly ensembles are routinely used to provide forecasters and users with the range of weather scenarios that could happen in the future. An example is the ECMWF ensemble-based strike probability for Hurricane Irma, issued by ECMWF on 5 September.
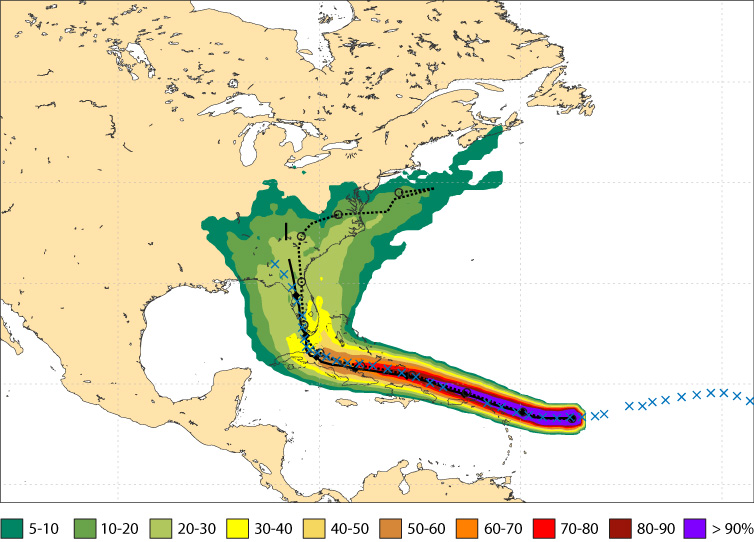
The chart shows the ECMWF ensemble-based probability that Hurricane Irma would pass within a 120 km radius during the next 10 days, according to the forecast issued at 00 UTC on 5 September 2017. Both ECMWF’s high-resolution forecast (solid line) and the ensemble mean (dotted line) turned out to be very close to the track as subsequently observed (crosses). However, the ensemble as a whole gave vital information on the range of possible tracks, something which a single forecast cannot provide.
Twenty teams worked day and night at the #OpenDataHack event hosted by ECMWF on 4 and 5 March to explore creative uses of open weather and climate data.
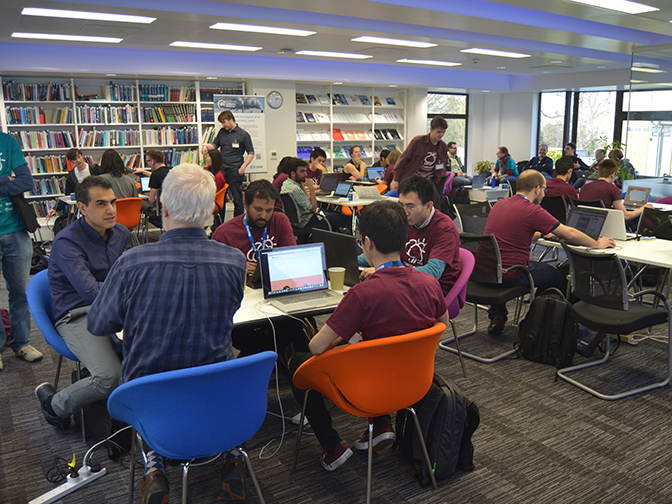
The #OpenDataHack teams were made up of over 70 developers, scientists and other data enthusiasts. (Photo: Maurizio Latini)
In May, ECMWF’s OpenIFS model was used in a workshop on ensemble forecasts at France’s École Nationale de la Météorologie (ENM) in Toulouse for the second year running.

Twenty-five postgraduate students took part in the OpenIFS training event at France’s École Nationale de la Météorologie in Toulouse. (Photo: Sébastien Laflorencie)
OpenIFS took centre stage again when 50 scientists met in the Italian city of Trieste from 5 to 9 June to explore seasonal predictability and teleconnections in the Earth system.
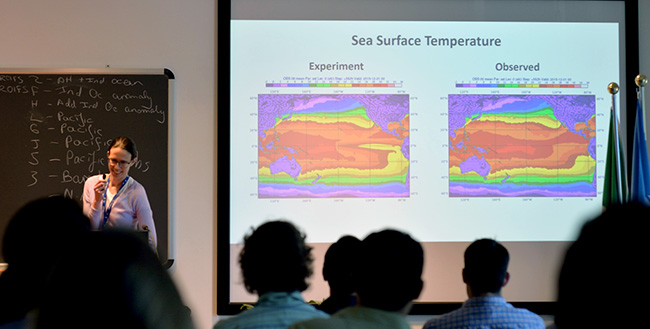
Some of the experiments carried out at the event in Trieste revolved around different El Niño scenarios and their potential consequences for global weather patterns.
Convection was one of the small-scale atmospheric processes at the heart of the workshop ‘Shedding light on the greyzone’ that took place at ECMWF from 13 to 16 November.

The difficulties of predicting convective processes even in the short range are illustrated by these mesoscale convective systems over equatorial Africa at 21 UTC on 12 July 2017 as observed by the Meteosat-10 satellite (left). The middle and right-hand panels show 3-hour accumulated precipitation from two members of a 42-hour, 18 km resolution ECMWF ensemble forecast starting at 00 UTC on 11 July 2017 with stochastically perturbed convection parameters.
More than 240 experts in reanalysis and representatives from the user community came together at the 5th International Conference on Reanalysis (ICR5) in Rome, organised jointly by C3S and the World Climate Research Programme (WCRP), from 13 to 17 November 2017.
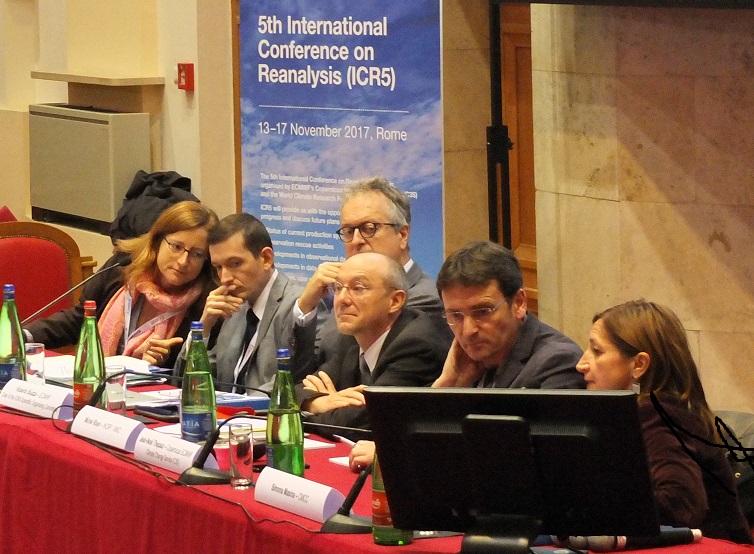
During a pre-conference media briefing, the organisers explained how reanalysis can support decision-making in a wide range of sectors. From left to right: Silke Zollinger (Copernicus ECMWF), Paul Poli (Météo-France), Roberto Buizza (ECMWF), Michel Rixen (WCRP), Jean-Noël Thépaut (Copernicus ECMWF), and Simona Masina (CMCC).
Also in 2017, ECMWF stepped up its efforts to provide processing and visualisation options in the Python programming language. To engage with the developer community, the Centre hosted a Python frameworks workshop on 28 and 29 November 2017.
Anniversaries
In 1992, ECMWF started producing probabilistic or 'ensemble' forecasts. Since then, ensemble forecasting at the Centre has been going from strength to strength, and it is now a cornerstone of ECMWF’s Strategy to 2025.
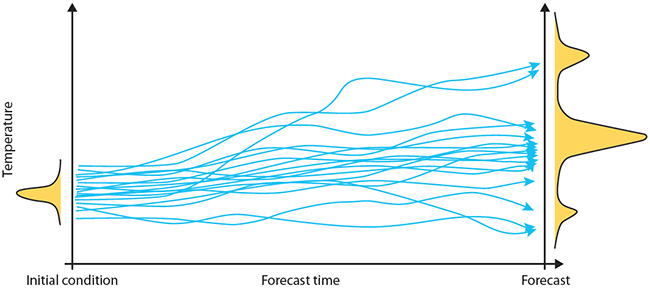
An ensemble of forecasts produces a range of possible scenarios rather than a single predicted value. The distribution of the ensemble members gives an indication of the likelihood of occurrence of those scenarios.
ECMWF Lead Scientist Roberto Buizza delivered a lecture on ’25 years of ensemble prediction’ on 7 December, on the occasion of the 91st Council meeting.
In 1997 ECMWF added an extra dimension – time – to the assimilation of observational data into weather models. This pioneering ‘4D-Var’ technique has led to substantial improvements in the Centre’s forecasts.
ECMWF Director-General Florence Rabier, ECMWF scientists Massimo Bonavita and Tony McNally, and Professor Olivier Talagrand explain how 4D-Var works and why it is so important for numerical weather prediction.
2017 was also the tenth anniversary of atmospheric composition forecasts at ECMWF. They started to be produced in May 2007, and today the representation of atmospheric composition processes in the IFS is an important aspect of the Centre’s Earth system approach designed to unlock new sources of predictability and harness a wider range of observations.
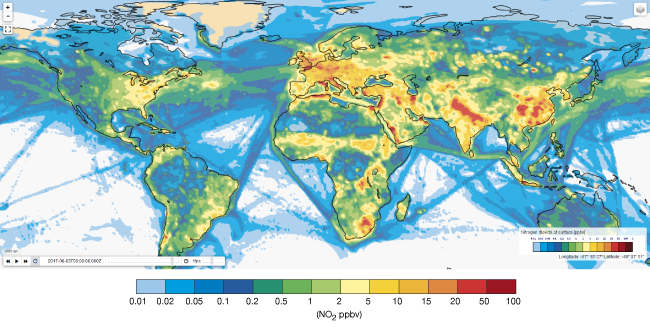
Successful forecasts of atmospheric composition require high-quality input from emission datasets and observations as well as a realistic model of all relevant processes. The chart shown here is a four-day forecast of nitrogen dioxide at the surface in parts per billion by volume (ppbv) for 3 June 2017 00 UTC. It highlights the impact of maritime transport as well as of land-based emissions in different parts of the world.
