
ECMWF has released global reanalysis data for the year 2014 on its public data server. ECMWF’s approach to reanalysis combines measurements of temperature and other meteorological variables with a global weather model to provide a complete picture of the regional patterns of climate.
Every day, ECMWF uses the latest observations from weather stations, aircraft, satellites and many other sources to produce up-to-date global estimates of surface air temperature. These estimates are needed along with other data to determine starting conditions for its weather forecasts. A few days later, the data are reanalysed using a global weather model that has been applied consistently to observations made from 1979 onwards. Combining observations with information from ECMWF’s global forecast model produces a comprehensive, consistent and up-to-date record of the recent climate, unavoidably also carrying a degree of uncertainty. Results for the final two months of 2014 from this widely used “ERA-Interim” reanalysis have now been released on ECMWF’s public data server.
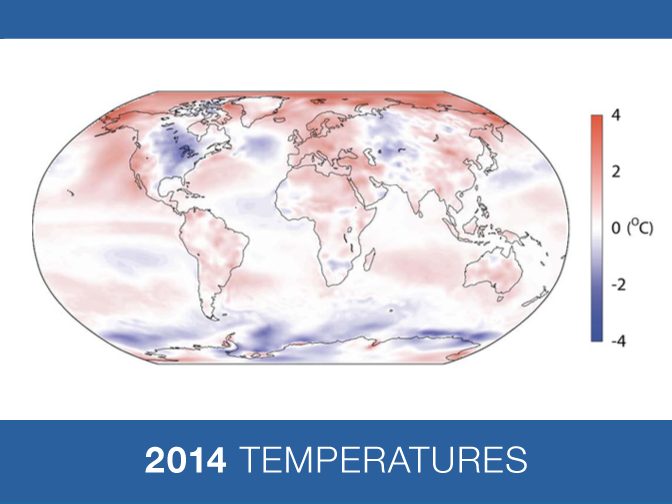
The map below presents the estimated change in average surface air temperature for 2014 relative to the thirty-year average from 1981 to 2010. It shows that most of the globe was warmer than the 1981-2010 average, but for example Antarctica was cooler. It more specifically illustrates the following variations:
- Conditions over Europe as a whole were particularly warm: the year was the warmest in the reanalysis period, in agreement with other analyses
- Unusually warm conditions also occurred:
- over the Middle East and North Africa,
- over and off the West Coast of North America, and
- over South America and Australia.
- Central and eastern North America were anomalously cold;
- The Arctic was relatively warm, as it has been for the past decade; while
- Antarctica and surrounding seas were colder than usual, overall.
Antarctic sea-ice has been reported independently to have been at record extent during 2014. The small number of weather stations in the region with complete records since 1979 also indicates predominantly below-average temperatures over the past year.

Mean surface air temperature for 2014 relative to the 1981-2010 average, based on the ERA-Interim reanalysis
The state of the climate for the year 2014 has received a great deal of attention in the media. Provisional estimates of average global temperatures based on monthly climatological land-station and sea-surface temperature records have suggested it could be the warmest year on record. ERA-Interim’s reanalysis confirms that 2014 was indeed a warm year, but indicates that it was probably not the warmest. This discrepancy is mainly due to differences in data coverage in the Arctic and Antarctic, which are enough to affect the ranking of different years.
All estimates of global mean temperature, including reanalysis, involve uncertainties. This means that reanalysis and estimates based solely on temperature measurements can differ slightly – and enough to affect the ranking of the warmest years. Taking into account the uncertainties, both methodologies place 2014 within the top 10% of the warmest years over the reanalysis period (since 1979), demonstrating the consistency of these various estimates.
The effect of data coverage on estimates of global warming.
The bar graph below shows two estimates of yearly average surface temperature change both derived from ERA-Interim.

The narrower, darker bars denote complete global averages, while the lighter, broader bars denote averages taken only over grid boxes which exclude most of the Arctic and Antarctic. Evidently the ranking of average temperatures depends on the data coverage, although the differences are within the bounds of uncertainty associated with the dataset.
For the purpose of this illustration we used HadCRUT4 geographical coverage for each month to sample ERA-Interim estimates. The November 2014 HadCRUT4 coverage was used for December 2014 as HadCRUT4 data were not yet available for the latest month.
HadCRUT4 data used courtesy of the Met Office, UK and the University of East Anglia (UEA), UK.