

ECMWF has extended the range of weather forecast products that are available freely and with no restrictions from its website. The new products are from the ECMWF ensemble prediction system (EPS) that provides guidance on the day-to-day predictability of the atmosphere. This gives an important complement to the information that is already available from the single deterministic model.
The ensemble is a set of 51 separate forecasts made by the same computer model, all started from the same initial time. The starting conditions for each member of the ensemble are slightly different. The differences between these ensemble members tend to grow as the forecasts progress. This dispersion varies from day to day, depending on the initial atmospheric conditions, and therefore gives an indication of the uncertainty in the current forecast.
The new graphical products show the ensemble mean (average over all 51 members) and ensemble standard deviation (spread) corresponding to each parameter available from the deterministic model: 500 hPa geopotential, 850 hPa wind and temperature and mean sea level pressure. These can be found at:
http://www.ecmwf.int/products/forecasts/d/charts/medium/eps/
A detailed explanation can be found by clicking on “show guide” on the left-hand side menu.
The corresponding charts from the deterministic forecast are available at:
http://www.ecmwf.int/products/forecasts/d/charts/medium/deterministic/
This extension of the freely available “essential” products was agreed by the ECMWF Council at its 72nd session in December 2009, as part of ECMWF’s continuing efforts to promote the benefits of ensemble forecasting.
For more information about the full range of ECMWF products, including access to digital data, see:
http://www.ecmwf.int/products/
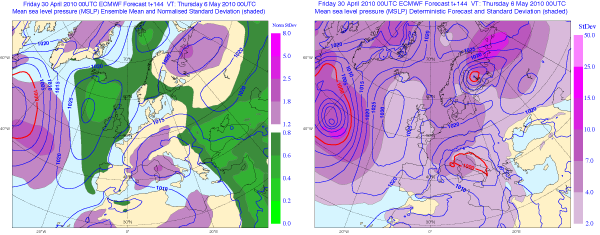
Example of the new ensemble mean and spread web product. The contours show the forecast mean sea-level pressure (MSLP) field for 6 days ahead from the ensemble-mean (left panel) and the single higher resolution 'deterministic' forecast (right panel). The spread within the ensemble is also represented on each panel, using coloured shading. On the right panel, spread is simply represented as the standard deviation. Small values (light shading) indicate small spread differences between the ensemble members and hence high confidence, while large values indicate large differences and therefore low confidence. The shading on the left panel shows a normalised standard deviation, putting the spread into the context of the general ensemble behaviour, in that area, over the last 30 days. In this example the spread indicates relatively high confidence (green) in the high pressure area over the UK, but more uncertainty (purple) in the low pressure areas in the Mediterranean and Atlantic.