ECMWF forecasts provided early indications of a windstorm that hit north-western Europe at the end of January 2016. Predicted winds and waves were slightly lower than those observed at North Sea oil platforms, but ensemble wave forecasts produced using ECMWF’s new higher-resolution model matched observations reasonably well.
The winter 2015–2016 started with a positive phase of the North Atlantic Oscillation (NAO), resulting in warm, windy and rainy weather in north-western Europe during December. The central and northern parts of the British Isles experienced two episodes of severe flooding after storms Desmond and Eva. In January, the weather turned colder in northern Europe with a weaker westerly flow. However, the positive NAO phase returned in the last days of January, bringing a severe windstorm to this part of Europe.
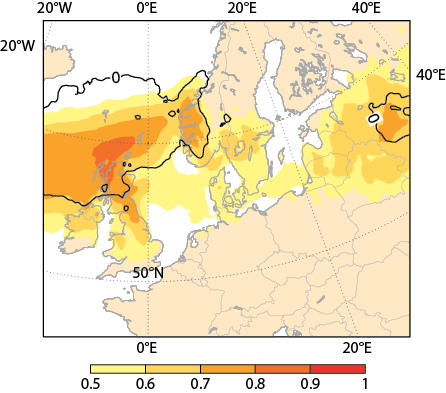
The cyclone, named Gertrude in the UK and Tor in Norway, formed south of Iceland late on 28 January. It rapidly deepened by 30 hPa during the next 24 hours and reached 948 hPa late on 29 January. Red warnings for extreme winds and high waves were issued for Shetland and the southern half of Norway, and amber warnings for Scotland. In Scotland, wind gusts of up to 50 m/s were measured. When the storm made landfall on the Norwegian coast, a new record mean wind speed for Norway was measured at Kråkenes fyr (lighthouse): a 10-minute average of 48.9 m/s, with gusts of up to 62 m/s. Fortunately, the storm did not cause any fatalities, and only limited damage was reported. This can partly be attributed to early warnings. ECMWF forecasts gave a clear indication of extreme winds six days in advance.


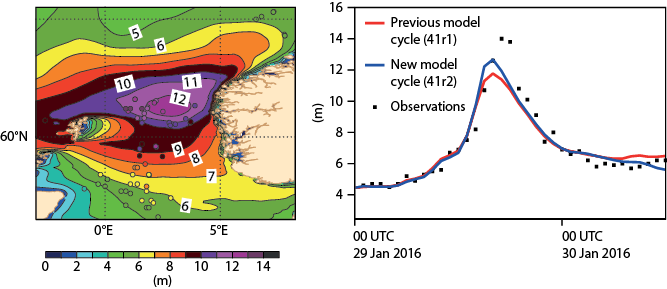
The band of the strongest winds stretched from Shetland towards the western part of Norway and passed the oil fields in the North Sea. Many of the oil platforms submit meteorological and wave observations every hour. This provided an opportunity for a detailed evaluation of ECMWF’s wave forecasts produced by the new model cycle 41r2 under extreme conditions, with significant wave heights up to 14 metres. With hourly data from the model, we can compare both the model cycle operational at the time (41r1) and the new model cycle (implemented on 8 March 2016) with observations from an oil platform located at 61.2°N, 1.1°E.
All of the last three forecasts before the peak of the event (28 Jan 12 UTC, 29 Jan 00 UTC and 12 UTC) underestimated the intensity of the peak in the mean wind at the oil platform (28 m/s compared to 38 m/s in the most extreme observation – not shown). However, one has to bear in mind that the measurements are probably made at a height greater than 10 metres and would have to be calibrated for a proper comparison with 10-metre wind forecasts produced by the model. For the wind speed, both model versions give similar values. The maximum significant wave height is also somewhat underestimated (12 metres in the forecast from 29 Jan 00 UTC compared to 14 metres in observations). Comparing the forecasts from the two model cycles, the wave forecast produced by the new model was about 1 metre higher at the peak of the event despite predicting similar wind speeds. This is due to the increased horizontal resolution both in the atmospheric model (9 km grid spacing instead of 16 km) and in the wave model (14 km instead of 28 km), as previously demonstrated for a severe storm that hit the Faroe Islands in November 2011.
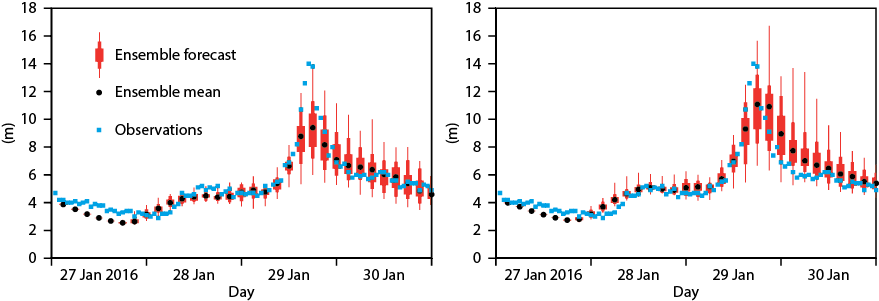
The ensemble forecast from the new model shows more extreme scenarios than that produced by the old model, and observed waves are within the range of uncertainty indicated by the forecast from 27 January 00 UTC. For this part of the North Sea, ensemble forecasts are essential as a small difference in the cyclone path can make a large difference in wave fields because of the sheltering effect of the Shetland Islands.


