
Julia Wagemann, Technical Data Analyst, Forecast Department
September 2018 will see the completion of ECMWF’s first Summer of Weather Code (ESoWC), a collaborative programme where we invited software developers, start-ups, weather professionals and scientists to work with us to create new and innovative weather-related code. The new developments will help ECMWF support national weather services in its Member and Co-operating States.
Four months full of coding, data wrangling and innovation are coming to an end. ECMWF experts acted as mentors to five teams, each working on a different challenge, ranging from the development of new and innovative visualisations to a web crawler for hydrological data and many more. The results will be presented during a “Week of Webinars” from 17 to 21 September.
Applications for the first ESoWC programme opened in January 2018. ECMWF staff proposed 13 challenges, aimed at streamlining and supporting daily activities at the Centre.
People were asked to submit a proposal to their preferred challenge. Proposals had to include an outline of the solution to the challenge. Over 170 proposals were submitted. The five best were selected and started their work at the beginning of May. Mentors and teams have had regular, virtual meetings to discuss problems and next steps.
Teams are being awarded £5000 for their developments, subject to reaching the initially specified targets.
5 teams – 5 challenges
Two out of five projects are developed by individuals, the others by teams of two or three.
The participants are scientists, developers, students and designers. Companies, such as 52North and predictia.es have participated, but individuals also, who participated in ESoWC in addition to their regular work.
All the project codes are available as open-source on GitHub or Bitbucket (see links below).
Enhanced GIS widget
Users often wrongly convert latitude and longitude coordinates which leads to the selection of a wrong area. This is highly inefficient for ECMWF as a data provider, as the same data request has to be processed multiple times. The challenge was aimed at developing a widget that selects and displays areas on a map. Such a widget will be useful for many web applications across ECMWF. The widget is based on Leaflet (a javascript library for interactive maps) and provides different tools, e.g. drawing and searching. The widget also offers a grid point system resembling ECMWF’s model grid points.
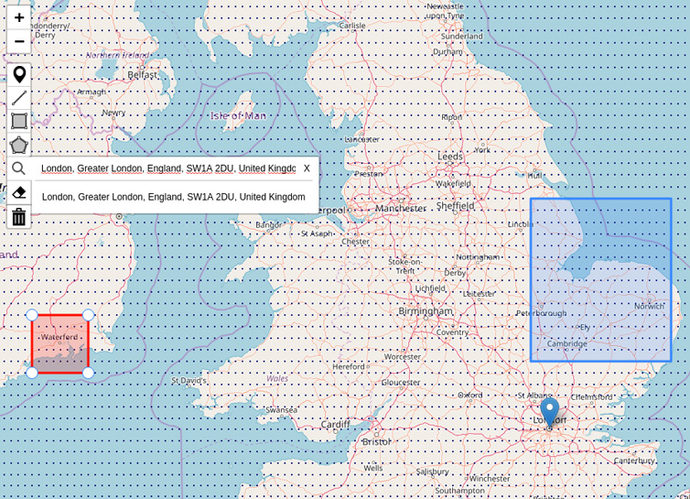
Enhanced GIS widget to select and display areas on a map.
Web crawler for hydrological data
Globally, new sources of raw data are being made available via the web all the time. However, ECMWF often isn’t aware of these. Manually identifying and gathering information on these new sources is both time consuming and error prone. This challenge was aimed at developing a tool to search the web systematically, identifying data sources for observed environmental data. The software automates the discovery, analysis and assessment of the candidate web pages in order to find new datasets. The resulting data can be used to improve global predictive weather forecasting models.
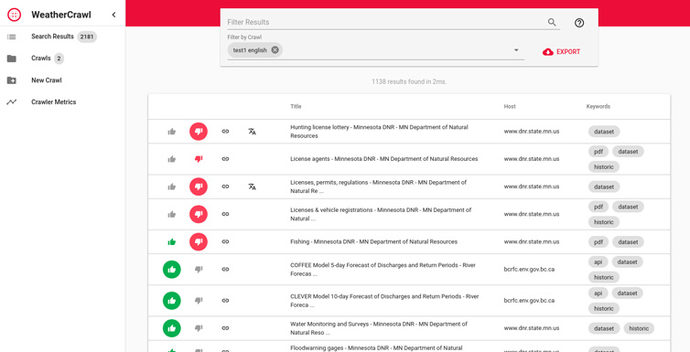
Web crawler that identifies new hydrological data.
Migration of calibration software to Python and development of its GUI
ecPoint-Cal is software that compares numerical model outputs against point observations to identify biases/errors at local scale. The software had two different processes and both steps were written in two different programming languages, which cannot be easily integrated. The challenge proposed migrating the existing code into Python and developing a user-friendly GUI for the software.
The new software, ecPoint-PyCal, provides a dynamic environment in Python and could ultimately be used to help steer model developments and to post-process ECMWF model parameters to produce probabilistic products for geographical locations.
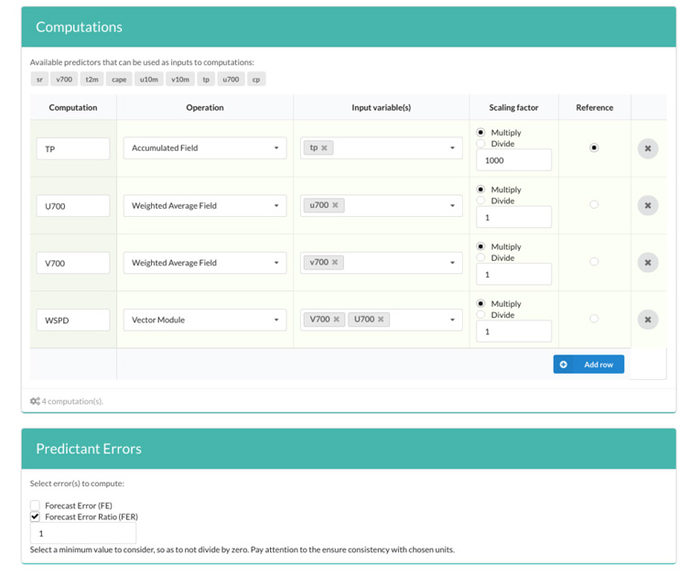
New software which compares numerical model outputs with point observations to identify biases/errors at local scale.
Innovative visualisations
ECMWF’s visualisations are developed with weather forecasters in mind. This challenge focused on developing new visualisations that help to communicate weather information to non-experts. The goal was to develop an innovative visualisation to present ensemble weather forecasts. A new design of a meteogram (a graphical presentation of multiple weather variables for a particular location) has been developed with value-suppressing uncertainty (VSU) icons. They allocate a larger range of icons when the uncertainty is low and a smaller range when the uncertainty is high (see figure below). This helps to make ensemble forecasts more accessible and to increase the overall trust in 15-day forecasts.
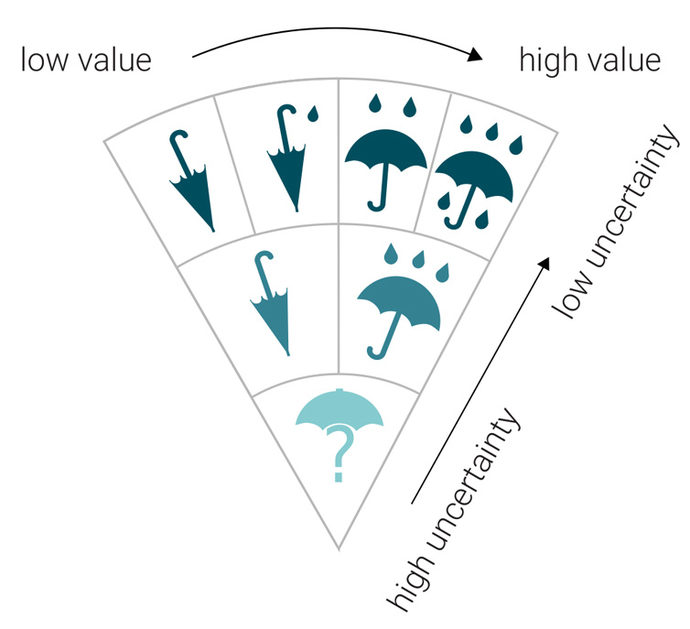
New visualisation to help to communicate weather information to non-experts.
NetCDF as a file system
Vast quantities of ECMWF data are stored in Network Common Data Format (NetCDF) and often there is a need to quickly create or adapt existing NetCDF datasets, for instance when prototyping a new data processing application. Tasks such as modifying the name or value of a NetCDF attribute or deleting unnecessary variables or attributes, typically require specialised NetCDF tools and libraries. This challenge aimed to develop a tool to represent the hierarchical structure of a NetCDF dataset as a virtual file system. The new software is written in Python and allows users to easily mount, view, and edit the contents of a NetCDF dataset using file-system operations and general purpose Unix tools. The software is potentially useful for anyone working with weather and climate data in NetCDF format wishing to quickly explore and edit a dataset.
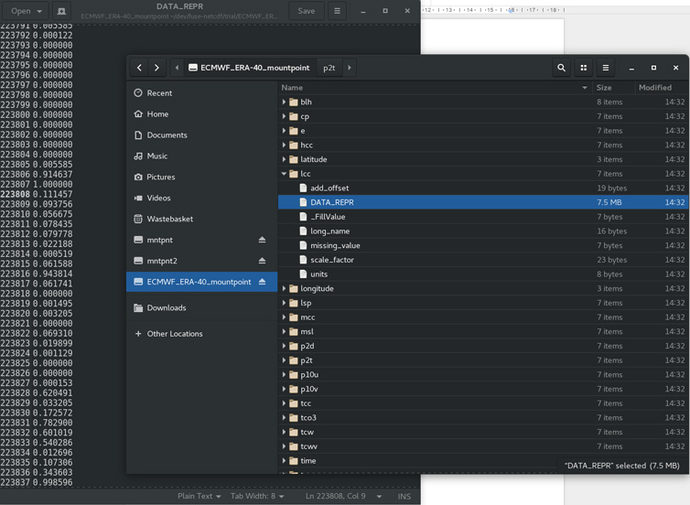
New software which allows users to easily mount, view, and edit the contents of a NetCDF dataset.
Presentation of the project outcomes during the “Week of Webinars”
The outcomes of the ESoWC 2018 will be presented during a “Week of Webinars” (17 to 21 September). A 60-minute webinar will take place each day from Monday to Friday at 16:00 BST. There will be a short introduction to the challenge followed by a presentation about the technical solution. There will be time for questions afterwards.
| Date | Time | Title |
|---|---|---|
| Monday, 17.09.2018 | 16.00 BST | Enhanced GIS widget |
| Tuesday, 18.09.2018 | 16.00 BST | NetCDF as a file system |
| Wednesday, 19.09.2018 | 16.00 BST | Migration of calibration software and development of its GUI |
| Thursday, 20.09.2018 | 16.00 BST | Web Crawler for hydrological data |
| Friday, 21.09.2018 | 16.00 BST | Innovative visualisations |
More information
All the project codes are available as open-source on GitHub or Bitbucket:
GitHub: Innovative Visualisations
GitHub: Migration of calibration software
GitHub: NetCDF as a file system
Bitbucket: Enhanced GIS widget (note: you will need access to Bitbucket to view this).
