

This year’s Annual Seminar is dedicated to ‘challenging physics in seamless prediction’. One of the speakers is Jean Bidlot, ECMWF’s expert for forecasting ocean waves and determining their feedback on the weather.
During his undergraduate studies in mechanical engineering in the late 1980s in Liège, Belgium, he was more interested in the mechanics of fluids rather than solid bodies. That is why he followed up his course with a PhD in geophysical fluid dynamics at Florida State University, USA.
After a research post at the Management Unit of the Mathematical Model of the North Sea in Belgium, he joined ECMWF in 1995. “My first task was to rewrite some of ECMWF’s wave model supercomputer code to adapt it to the new Fujitsu high-performance computing facility that was being brought in,” Jean says.
“But soon enough I was working with Peter Janssen on coupling the wave model to the atmospheric model, of which it had been quite independent until then.”
In the nineties, concepts such as an ‘Earth system model’ were not yet common in weather forecasting. “Incorporating ocean waves into an Earth system model is such a tricky business that to this day many forecasting models don’t consider the direct effect of ocean waves on the atmosphere,” Jean observes.
As wave forecasting improved, it became possible to gain new insights into ‘freak waves’, such as the 25.6 m high wave recorded at the North Sea Draupner gas platform in 1995.
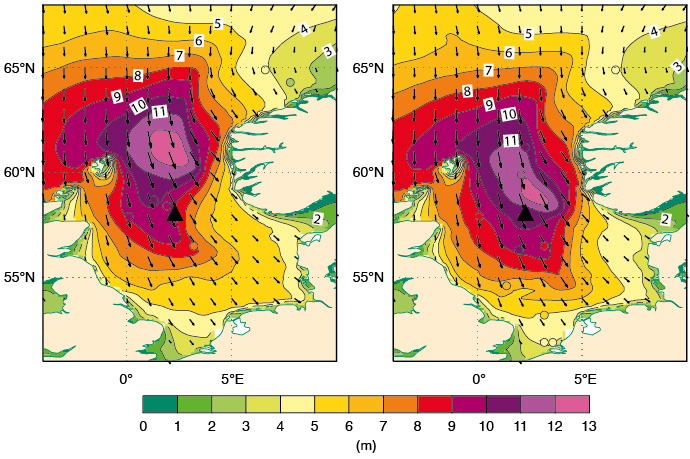
Re-forecasts of significant wave height distribution (shading) and mean wave direction (arrows) in the North and Norwegian Seas on 1 January 1995, using a horizontal grid spacing of about 9 km, showing a 12-hour forecast (left) and a 15-hour forecast (right), both starting from 00 UTC. The black triangle shows the position of the Draupner platform. Coloured circles denote corresponding wave height observations (same colour scale as for the forecasts) as archived at ECMWF. For more details, see the article ‘What conditions led to the Draupner freak wave?’ in ECMWF Newsletter No. 148.
Coupled wave forecasting
The system which links waves and winds in a two-way fashion was introduced at ECMWF in 1998. “Winds stir up the waves, of course, but waves also slow down the wind,” Jean observes. In addition, waves influence conditions in the ocean, for example by increasing the mixing of ocean water near the surface and thus changing the ocean temperature profile.
“Acknowledging these interactions is part of what makes ECMWF’s Integrated Forecasting System (IFS) a world-leading system.”
Since 1998, the IFS has undergone many upgrades. In one of them, introduced in 2019, the way waves lose energy was reviewed.
“One of the processes involved is wave breaking,” Jean says. “This is still very much an open area of research, but the change in 2019 integrated some developments from the wave modelling community into our coupled system.”
To achieve that, Jean had to adapt the new scientific developments to ECMWF’s systems. The result was that forecasts were improved, notably by reducing the energy of waves that have travelled a long way from where they were generated.
The changes also slightly increased wave height in extratropical storm tracks. Significant wave height, a sea-state parameter which is roughly the average height of the highest one third of waves, was generally reduced in the tropics and increased in the extratropics.
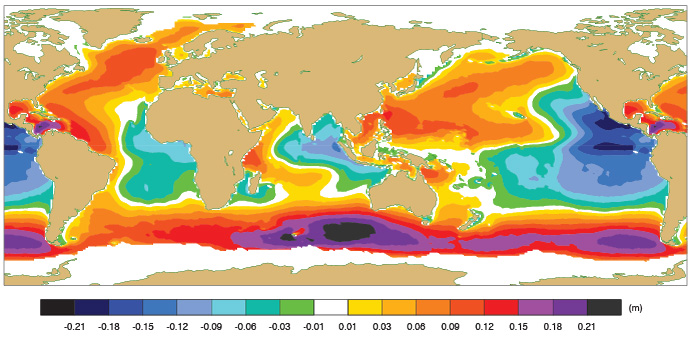
Annual mean difference in significant wave height between the wave physics before and after the changes introduced in 2019. The data are from standalone wave model runs with atmospheric and ocean variables provided by the ERA5 reanalysis. For more details, see the relevant web article.
Particular attention had to be paid to the coupling in ECMWF forecasts between waves and the atmosphere. “We are trying to represent real nature, but in terms of model development it’s much more difficult than a non-coupled model because you have to pay attention to many more components of the system.”
Stronger winds in tropical cyclones
Some years ago, it was felt that the IFS was not as good as it could be in predicting the winds produced by tropical cyclones.
“In exchanges with the US National Centers for Environmental Prediction (NCEP) and Météo France, it became clear that they were using different parametrizations for extreme winds in tropical cyclones,” Jean says. “Essentially, they were assuming that the transfer of momentum from the wind to the waves was decreasing in extreme winds.”
Jean developed a way of representing this in ECMWF’s coupled system. “This is a parametrization that currently lacks a physical basis, but it is in line with observations,” he says. “It leads to stronger winds in intense tropical cyclones.”
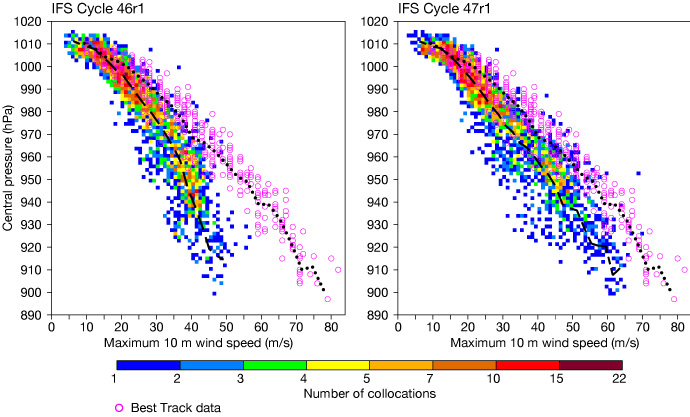
Scatter plots for maximum 10 m wind speed and corresponding minimum mean sea level pressure for all 10-day forecasts at TCo1279 resolution (corresponding to a grid spacing of about 9 km) from 00 UTC for the period 25 August 2019 to 1 January 2020 (coloured squares; the dashed line indicates mean central pressure for a given wind speed), and corresponding reported values (6-hourly Best Track data; purple circles; the dotted line indicates mean central pressure for a given wind speed), for 20 tropical cyclones, for IFS Cycle 46r1 (left) and IFS Cycle 47r1 (right). For more details, see the Newsletter article on ‘Enhancing tropical cyclone wind forecasts’.
“This change also turned out to be important for smaller spatial resolutions, which ECMWF is testing.”
Jean is now working with Peter Janssen, who used to work for ECMWF, on a new realisation which is more physically based. “This will mean a much wider set of situations in which there will be changes, not just tropical cyclones,” he says.
Wave forecast verification
Jean’s involvement in wave forecast verification goes back to the time when he was about to join ECMWF. “At a scientific meeting, it was suggested that we start a project where we try to validate our wave forecasts,” he says.
He ended up running an international validation system for the next 20 years in an informal manner. Since then, the system has been formalised and is now implemented by ECMWF’s Forecast Department.
“The system is based on comparing forecasts with observations. It now involves about 20 centres and has been recognised as being very useful: it has led to improvements in many forecasting centres.”
More details can be found in a Newsletter article on ‘Twenty-one years of wave forecast verification’.
The role of waves in ECMWF’s forecasts
Wave forecasts are an integral part of ECMWF’s weather forecasts: they depend on them, but they also influence them.
Wave forecasts also have specific users. “The numbers tend to be relatively small because most human activities are on land, but some of the most dangerous activities humans are engaged in are at sea, and that’s why you need wave information,” Jean says.
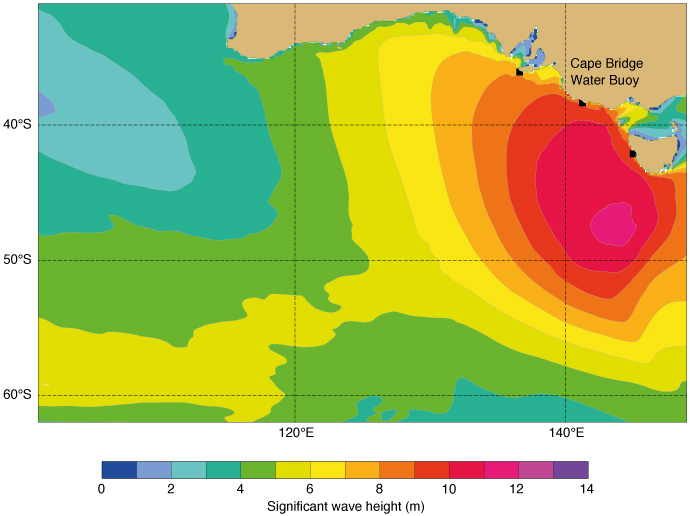
This image shows an experimental 63-hour forecast of significant height of combined wind waves and swell at 15:00 UTC on 10 April 2021 for southern Australia, planned for IFS Cycle 49r1. On this occasion, the high waves threw boulders on the shore.
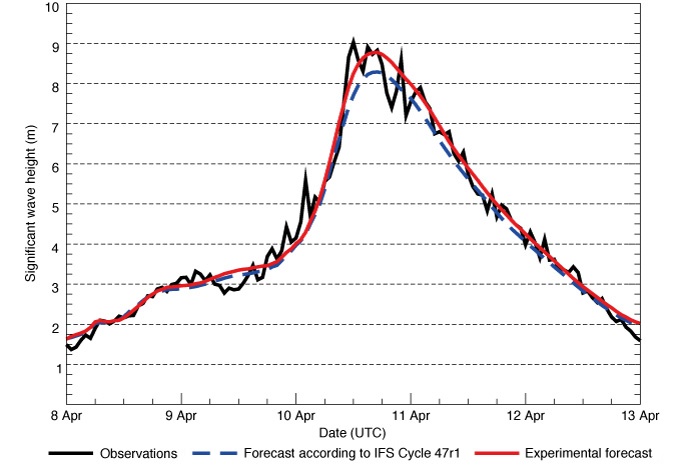
This chart shows significant wave height observations at the Cape Bridge Water Buoy, whose location is shown in the chart above, and forecasts from 00 UTC on 8 April 2021 using the forecasting system current at the time (IFS Cycle 47r1) and an experimental forecasting system (due to be implemented in IFS Cycle 49r1). The new forecast captures the peak of the waves in that location better.
A colleague, Josh Kousal, has recently been appointed to work on waves as part of ECMWF’s Destination Earth (DestinE) activities. DestinE is an ambitious initiative of the European Union to create a digital twin – an interactive computer simulation – of our planet.
“I will work with Josh to drive the representation of waves in our forecasts forward. We are part of a more general team on processes that interact with the atmosphere above,” Jean observes. This concerns the land, snow, the ocean, sea ice and waves.
“However, technically speaking waves are part of marine weather, so we are providing an essential part of ECMWF’s forecasts.”
