

Mark Parrington joined ECMWF in 2013.
ECMWF scientist Mark Parrington studied physics to find out how the world works. Today he applies the skills he has acquired to tracking changes in atmospheric composition and communicating his findings to the public.
During his undergraduate course, Mark specialised in atmospheric physics. A one-year placement at the Rutherford Appleton Laboratory in the UK familiarised him with remote sensing techniques to measure and monitor atmospheric composition.
He followed up on this with a DPhil from the University of Oxford on satellite limb sounding of ozone in the upper troposphere and lower stratosphere. During postdoctoral work on modelling atmospheric chemistry and chemical data assimilation at the Universities of Cambridge, Toronto and Edinburgh, he started to work on quantifying boreal wildfire emissions and their impact on atmospheric composition.
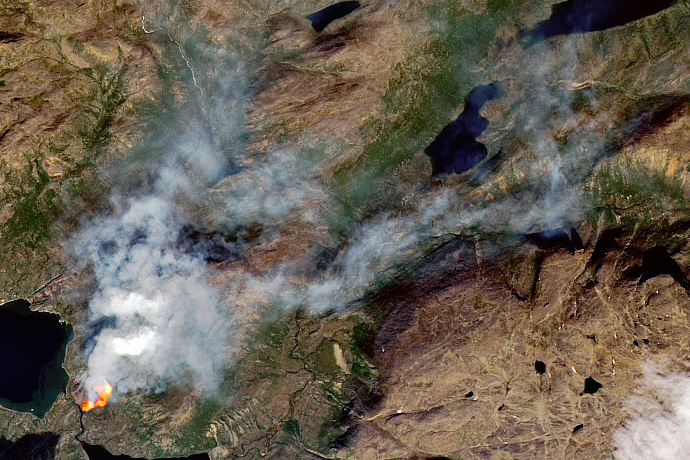
This fire burnt in western Greenland just north of the Arctic Circle on 10 July 2019, as observed by the US Landsat 8 satellite. The summer of 2019 was notable for unusual wildfire activity within the Arctic Circle. (NASA/Visible Earth)
“My interest in atmospheric composition was first sparked by media reports on the ozone hole when I was an undergraduate in the mid-1990s,” Mark notes.
“I wanted to know how satellites can be used to understand the physics and chemistry of the atmosphere. Later I came to specialise in wildfire emissions. These have recently received much media coverage due to their links with air quality and climate change.”
In 2013, Mark joined ECMWF to work on the assimilation of satellite observations of the vertical profiles of carbon monoxide and ozone and aircraft observations of greenhouse gases. At the time, ECMWF was getting ready to implement the EU-funded Copernicus Atmosphere Monitoring Service (CAMS).
Today he is a senior scientist in CAMS with a high profile in the science community and in the media.
In CAMS, his first area of work was to monitor wildfire activity and communicate his findings to the public. This has now widened to cover all the main CAMS services, including global and regional forecasts of atmospheric composition.
“Together with colleagues, I constantly monitor atmospheric composition developments to see how well we are performing and whether there are any that might be of interest to the media and the wider public,” Mark says.
Examples of developments Mark looks out for include dust storms and air quality issues as well as wildfire emissions. The latter made plenty of global headlines in 2019.
Covering the 2019 wildfires
Last year, surges in wildfire activity in the Arctic, the Amazon basin and Australia sparked intense media interest.
Mark had data, charts and expert knowledge to hand to explain the situation to the public.
He was able to do this as the scientist in charge of the CAMS Global Fire Assimilation System (GFAS). GFAS estimates daily global wildfire emissions based on satellite observations of fire radiative power. The estimated emissions are an important input to CAMS atmospheric composition and air quality forecasts.
When Mark took on this area of work, he produced charts, based on GFAS data, to help him gain an understanding of the wildfire situation across the world.
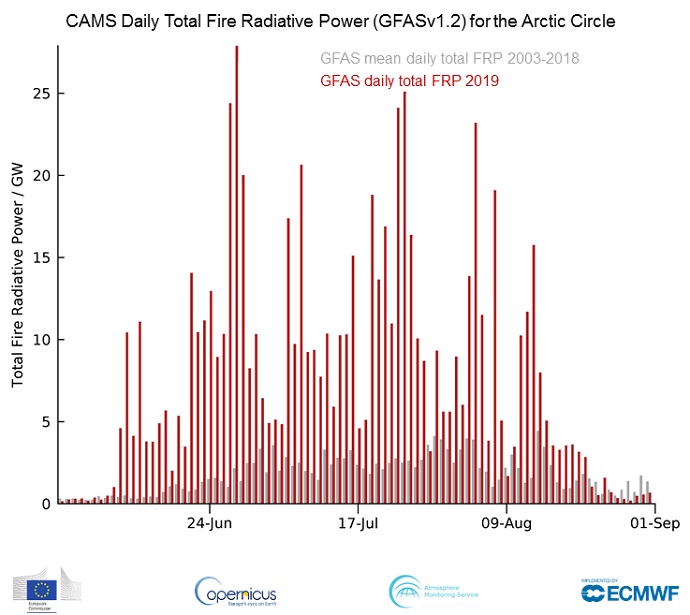
CAMS data show that the intensity of fires within the Arctic Circle in the summer of 2019 was often far above the average value for the years 2003–2018. (Data source: CAMS Global Fire Assimilation System)
As illustrated by the example above, the charts show the evolution of fire activity day by day for a specified region together with the long-term average for those days.
“In these charts, fire activity is represented by total fire radiative power as measured by satellites,” Mark explains. “Another chart I often use shows the long-term evolution of total estimated fire emissions of, for example, CO2 to give the context to current activity.”
Mark has been able to use these two types of chart to excellent effect in his science communication activities.
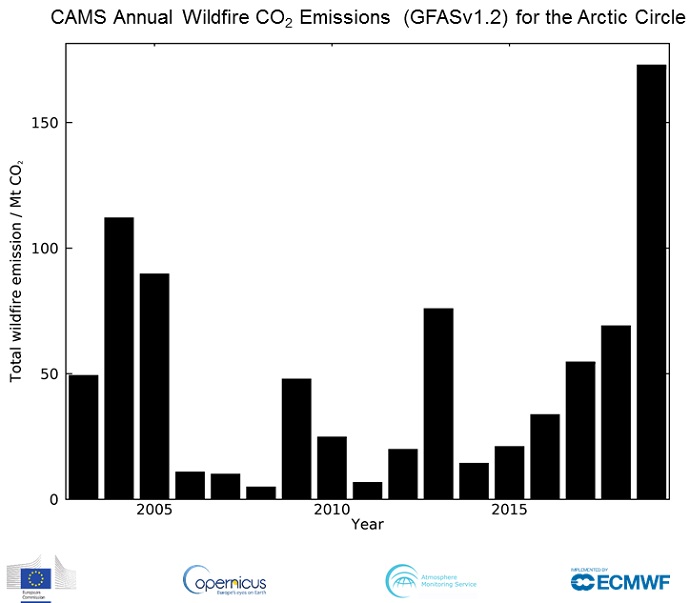
The chart shows the total estimated wildfire CO2 emissions for June–July–August in the Arctic Circle from 2003 to 2019. It highlights the exceptional amount of emissions in 2019 compared to previous years. (Data source: CAMS Global Fire Assimilation System).
Links to air quality and climate
Mark is also interested in going further by setting out possible causes and consequences of unusual developments – provided the explanations are based on data and solid science.
“By making links with other datasets, such as climate data on precipitation and soil moisture, we may be able to point to explanations for what we observe,” he says.
For example, much of the fire activity within the Arctic Circle in 2019 occurred in locations with relatively low rainfall and dry soil.
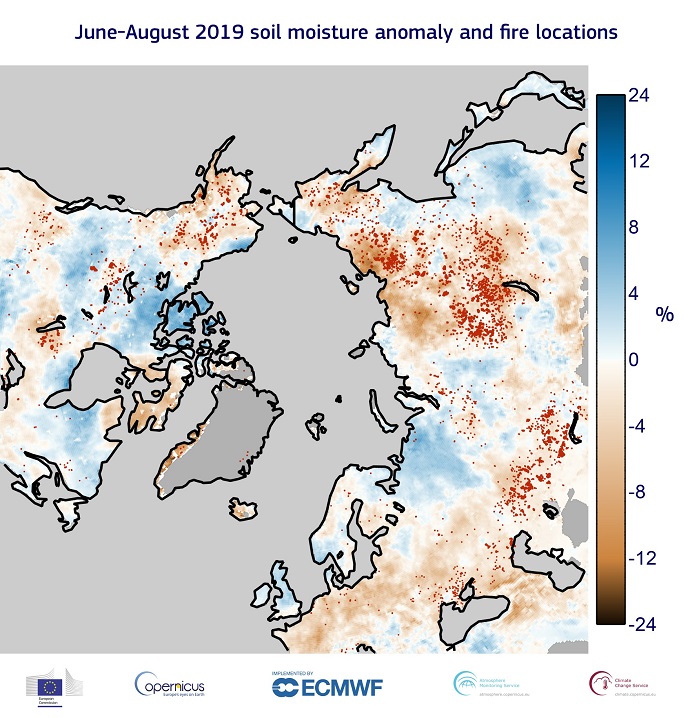
The shading shows the June–August 2019 soil moisture anomaly compared to the 1981–2010 reference period, based on the ERA5 reanalysis dataset. Fire locations (red dots) during June–August 2019 are based on the Global Fire Assimilation System (GFAS) dataset. (Credit: Copernicus Climate Change and Atmosphere Monitoring Services; European Centre for Medium Range Weather Forecasts)
Wildfire activity may also influence the future evolution of the climate, although the size of the effect is difficult to quantify.
“Particulate matter settling on snow or ice can alter the albedo and lead to sunlight being absorbed rather than reflected,” Mark points out. “In addition, some of the CO2 released in wildfires, for example from burning peat, may not be reabsorbed in future regrowth. Any net emissions will contribute to global warming.”
Mark emphasises that wildfires are also linked to air quality. “They emit a range of pollutants, such as particulate matter, nitrogen oxides, volatile organic compounds and greenhouse gases,” Mark says. “These substances can substantially influence air quality over large regions through chemistry and long-range transport. In CAMS we have a wide range of data which we can use to monitor and predict many different aspects of air pollution worldwide.”
CAMS forecasts merge information on atmospheric composition with all the meteorological information contained in ECMWF weather forecasts. They can thus be used to predict the trajectory of pollution plumes.
CAMS data showed that Australian bushfires starting in September 2019 were unprecedented in certain regions when compared to the previous 16 years, causing widespread air quality issues. As seen in this Euronews video, smoke was subsequently transported beyond New Zealand and over the South Pacific Ocean, reaching as far as South America.
Communicating CAMS findings
As the northern hemisphere boreal wildfire season gets under way, Mark knows that his expertise may once again be in high demand.
Media appearances last year included TV interviews with BBC News, BBC World and Euronews. In addition, Mark regularly features in radio programmes, podcasts and top print media, from the Washington Post to Britain’s The Guardian and Germany’s Der Spiegel.
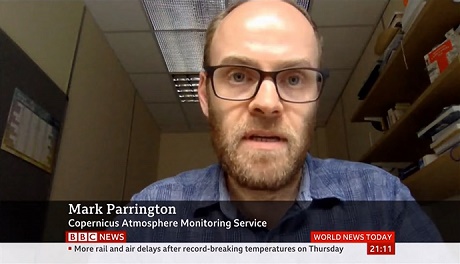
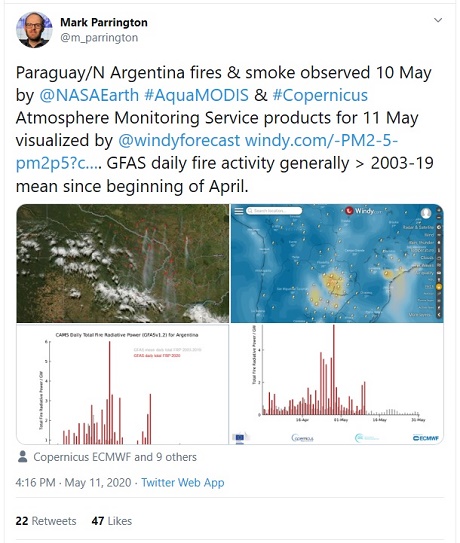
“Media outlets often contact me after seeing material I have posted on social media,” Mark observes.
His Twitter feed is a rich source of information on what is happening in the field of atmospheric composition, including air quality and wildfire emissions.
Mark also shares his expertise through training, often conducted in collaboration with ESA and EUMETSAT through summer schools, workshops and training courses. A recent example is Mark’s participation as a lead educator in the MOOC on atmospheric composition developed jointly by EUMETSAT and CAMS.
A good 20 years after finishing his physics degree, Mark continues to be fascinated by the science of atmospheric composition.
“I’m glad that I am able to use everything I have learned throughout my scientific career on a day-to-day basis to monitor how the atmosphere is changing and to share my findings to help society take the right decisions on air quality, environmental hazards and climate.”
