
Early in her training in mathematics, Inna Polichtchouk developed an interest in atmospheric dynamics. Her expertise is now helping ECMWF to get a better grip on the dynamics of the stratosphere with an emphasis on reducing model errors in forecasts at all timescales.
Most fellow students on Inna’s mathematics degree course opted for work experience in finance or teaching. Inna decided to cast her net more widely and chose a different field of application: numerical weather prediction (NWP).
After two work placements at the UK Met Office and a master’s thesis on the atmospheres of hot Jupiter-type exoplanets, she decided to pursue a PhD in atmospheric dynamics.
For her thesis, she assessed the ability of idealised general circulation models to describe atmospheric conditions on extrasolar planets very different from Earth: places where winds reach the speed of sound and temperature differentials between the permanent night side and the permanent day side are 500°C or more.
Her finding: the models that work for Earth may well not be suitable for such extreme conditions. In fact, different models came up with very different predictions for the evolution of such atmospheres.

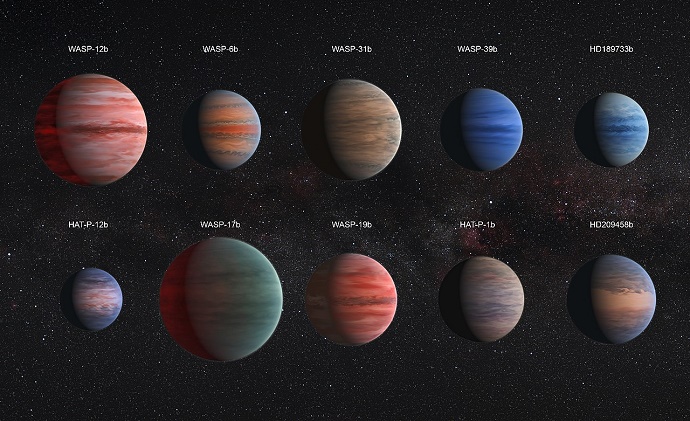
Artist's impression of the kind of ‘hot Jupiter’ planets Inna studied. (ESA/Hubble, CC BY 4.0)
Inna’s doctoral work familiarised her with the ‘dynamical core’ of global NWP models. This part of the model uses advanced numerical methods to solve the equations governing atmospheric dynamics.
“I felt that working on the fluid envelope of Earth rather than of exoplanets has a decisive advantage: it is possible to verify what the model predicts against subsequent observations,” Inna says.
During post-doctoral work on atmospheric dynamics at the University of Reading, she became involved in the work of ECMWF’s Stratosphere Task Force and joined the Centre in 2018.
Temperature biases in the stratosphere
There is a reason why there was a Stratosphere Task Force at ECMWF: successive model upgrades had led to substantial temperature biases in ECMWF forecasts for this part of the atmosphere.
It is true that the stratosphere is not where weather happens. Clouds, precipitation and all the other conditions we classify as weather mostly occur in the troposphere below.

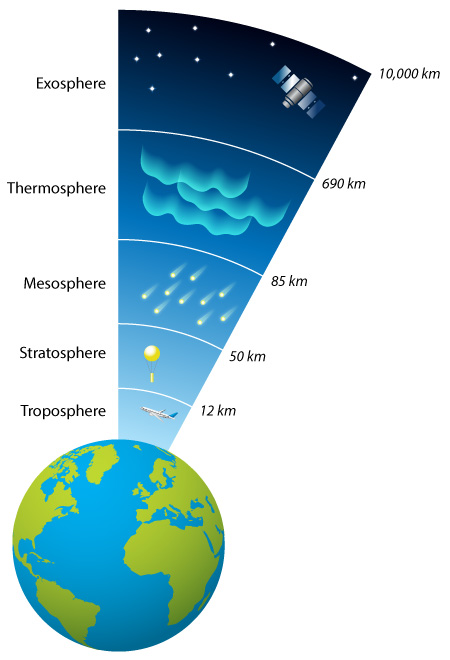
The stratosphere is the second major layer of the atmosphere, starting at heights of 8–20 km and extending to 50 km above the surface. The troposphere is where clouds form and weather takes place, but conditions in the stratosphere can influence the weather below.
Nevertheless, in order to model the troposphere correctly, we need to know what happens above. “Conditions in the troposphere influence those in the stratosphere and vice versa,” Inna points out.
“For example, events such as sudden stratospheric warmings can influence the weather below up to a couple of months ahead. Correctly predicting such events boosts our ability to make weather predictions, especially in the extended range beyond 10 days ahead.”
Now back to those biases: Inna’s task was to identify the root cause of the stratospheric temperature biases in ECMWF’s Integrated Forecasting System (IFS).
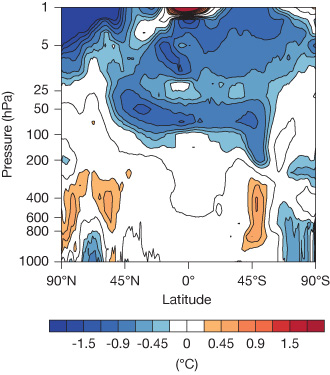
“In the IFS, the lower to mid-stratosphere is biased cold and the uppermost stratosphere is biased warm,” Inna explains.
“These biases are sensitive to horizontal resolution: at higher horizontal resolution, the cold bias in the lower to mid-stratosphere is exacerbated and the warm bias in the uppermost stratosphere is alleviated.”

The chart shows difference in zonally (latitudinally) averaged temperature between forecasts at a horizontal resolution corresponding to a grid spacing of about 9 km and a horizontal resolution corresponding to a grid spacing of about 79 km. Blue colours indicate that high horizontal resolution forecasts are colder. Mean values over 31 forecasts starting in December 2017 and valid at day 10 are shown.
Having worked through a range of possible causes in collaboration with fellow scientists at ECMWF, Inna concluded that the problem lay with the representation of vertical waves in the dynamical core of the model.
“As the horizontal resolution increases, small-scale waves that are resolved in the horizontal direction are difficult to adequately represent in the vertical direction when vertical resolution is not appropriately increased as well,” Inna explains.
A new method to tackle the biases
Increasing the vertical resolution is computationally expensive. Inna’s team leader, Michail Diamantakis, proposed a different approach: higher-order vertical interpolation. Michail, Inna and their colleague Filip Váňa have implemented that method in the IFS in readiness for the next IFS upgrade.
The starting point is that numerical weather prediction finds values for atmospheric variables at millions of grid points distributed over the atmosphere.
The values in between those grid points have to be estimated or ‘interpolated’ from the grid point values. Systematic errors in these estimates are a possible source of bias in weather forecasts.

Interpolation estimates values at intermediate points between a given set of points, as shown here for a simple ‘nearest neighbour’ interpolation (left), linear interpolation (middle) and cubic interpolation (right), with estimates of values at intermediate points shown as red dots and the values at the given set of points as blue dots. (Image: Cmglee – CC BY-SA 4.0)
Higher-order interpolation uses polynomial expressions with larger exponents and more neighbouring points to achieve a better estimate than lower-order interpolation.
“We found that moving from third‑order (cubic) to fifth‑order (quintic) vertical interpolation reduces unphysical cooling at high horizontal resolution in the stratosphere with little impact at low horizontal resolution,” Inna says.
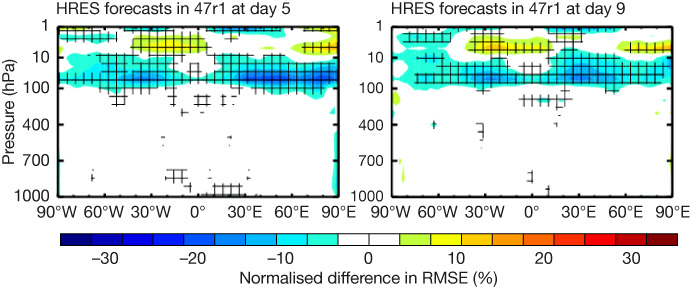
Tests of the new method confirmed significant improvements in stratospheric temperature forecasts. As a result, quintic vertical interpolation will be introduced in the next IFS upgrade to IFS Cycle 47r1 planned for 30 June 2020.

The charts show the change in root-mean-square error (RMSE) of temperature forecasts when moving from cubic to quintic vertical interpolation for ECMWF’s high-resolution forecasts (HRES) in the IFS Cycle 47r1 test suite, for the period 20 July to 19 December 2019. Blue colours indicate that errors are smaller when quintic vertical interpolation is used. Hatched areas indicate statistical significance at an estimated 90% confidence level.
Inna’s next task will be to test a method, developed by Filip Váňa, that could be used as an alternative to or in conjunction with quintic vertical interpolation: filtering out small-scale vertical waves in the stratosphere.
“Apart from tackling stratospheric temperature biases, I’m working on several other projects, such as reducing the thickness of the ‘sponge layer’ at the top of the stratosphere, in which we let model values tail off to avoid creating unrealistic reflections at the model top,” Inna says.
“Achieving improvements in a finely tuned system such as the IFS is not easy, but I’m up for the challenge!”
Further information
For more information on Inna’s work, read her ECMWF Newsletter article on quintic vertical interpolation.
