
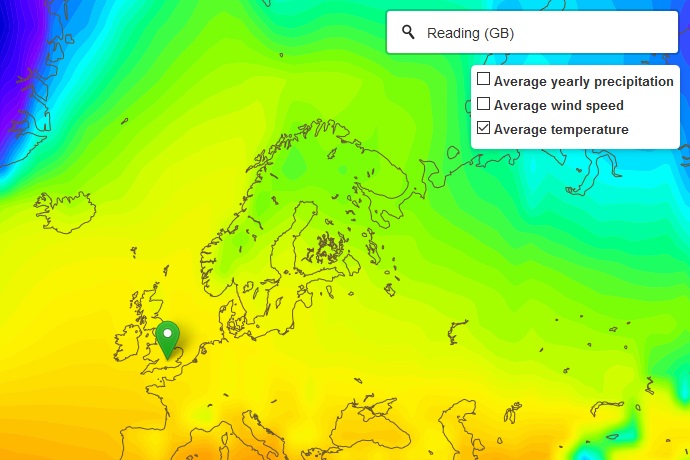
The EU-funded Copernicus Climate Change Service (C3S) implemented by ECMWF has developed a Climate Data Store that lets anyone discover the world’s past, present and projected climate.
Scientists, businesses, policy-makers, educators and the general public can freely access, explore and download the data. The Climate Data Store also gives them coding tools to develop tailor-made applications to suit their needs.
A particularly popular dataset is ECMWF’s new ERA5 reanalysis of the world’s past weather and climate. The data, which currently cover the last 40 years, will soon reach back to 1950.
To make these data easily accessible, ECMWF has developed the ‘ERA5 Explorer’, one of many applications freely available in the Climate Data Store (CDS).
“This easy-to-use application lets anybody explore a range of climate indicators for any place on Earth in a highly visual way,” says James Varndell, who developed the ERA5 Explorer using the CDS Toolbox.
The ERA5 Explorer was inspired by the Past Climate Explorer, an application developed by Spanish company Lobelia using the free and open data that C3S makes available.
What’s it like where you are?
ECMWF’s headquarters are in Reading, UK. If you want to know what it is like to live here, or anywhere else in world, you could start by exploring the local climate using the ERA5 Explorer.

These stripes show how much colder (blue) or warmer (red) the average temperature was in every year in the period 1979 to 2018 for Reading, UK, relative to the long-term reference period of 1981 to 2010.
For the broad context on temperature, you may want to look at the warming stripes, which the Explorer can generate for any place on Earth.
They show that the local climate in Reading has warmed in recent decades, but they also highlight a few relatively cold years. Hovering over the stripe for 2010 reveals that the average temperature that year was 1.0°C colder than the long-term average.
For more detail, you can call up a chart that shows how many ‘frost days’ (minimum temperature below 0°C), ‘summer days’ (maximum temperature above 25°C) and ‘tropical nights’ (minimum temperature above 20°C) to expect in a typical month.
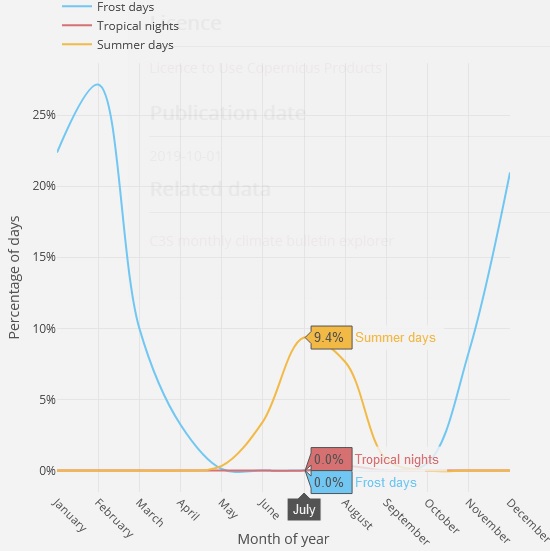
Typical monthly percentage of days which count as ‘frost days’, ‘summer days’ and ‘tropical nights’ in Reading, UK.
The UK may not be known as a particularly hot country, but in Reading at least there are typically some days in July and August that could count as ‘summer days’!
Now over to you: the ERA5 Explorer lets you discover the local climate, not just temperature but also wind and precipitation, wherever you are or would like to be.
Getting the most out of the data
The ERA5 Explorer is just one of a host of open-source applications available in the Climate Data Store that have been built using the CDS Toolbox.
Another one enables users to scroll through maps of Arctic sea-ice cover to see how it has evolved in recent years.
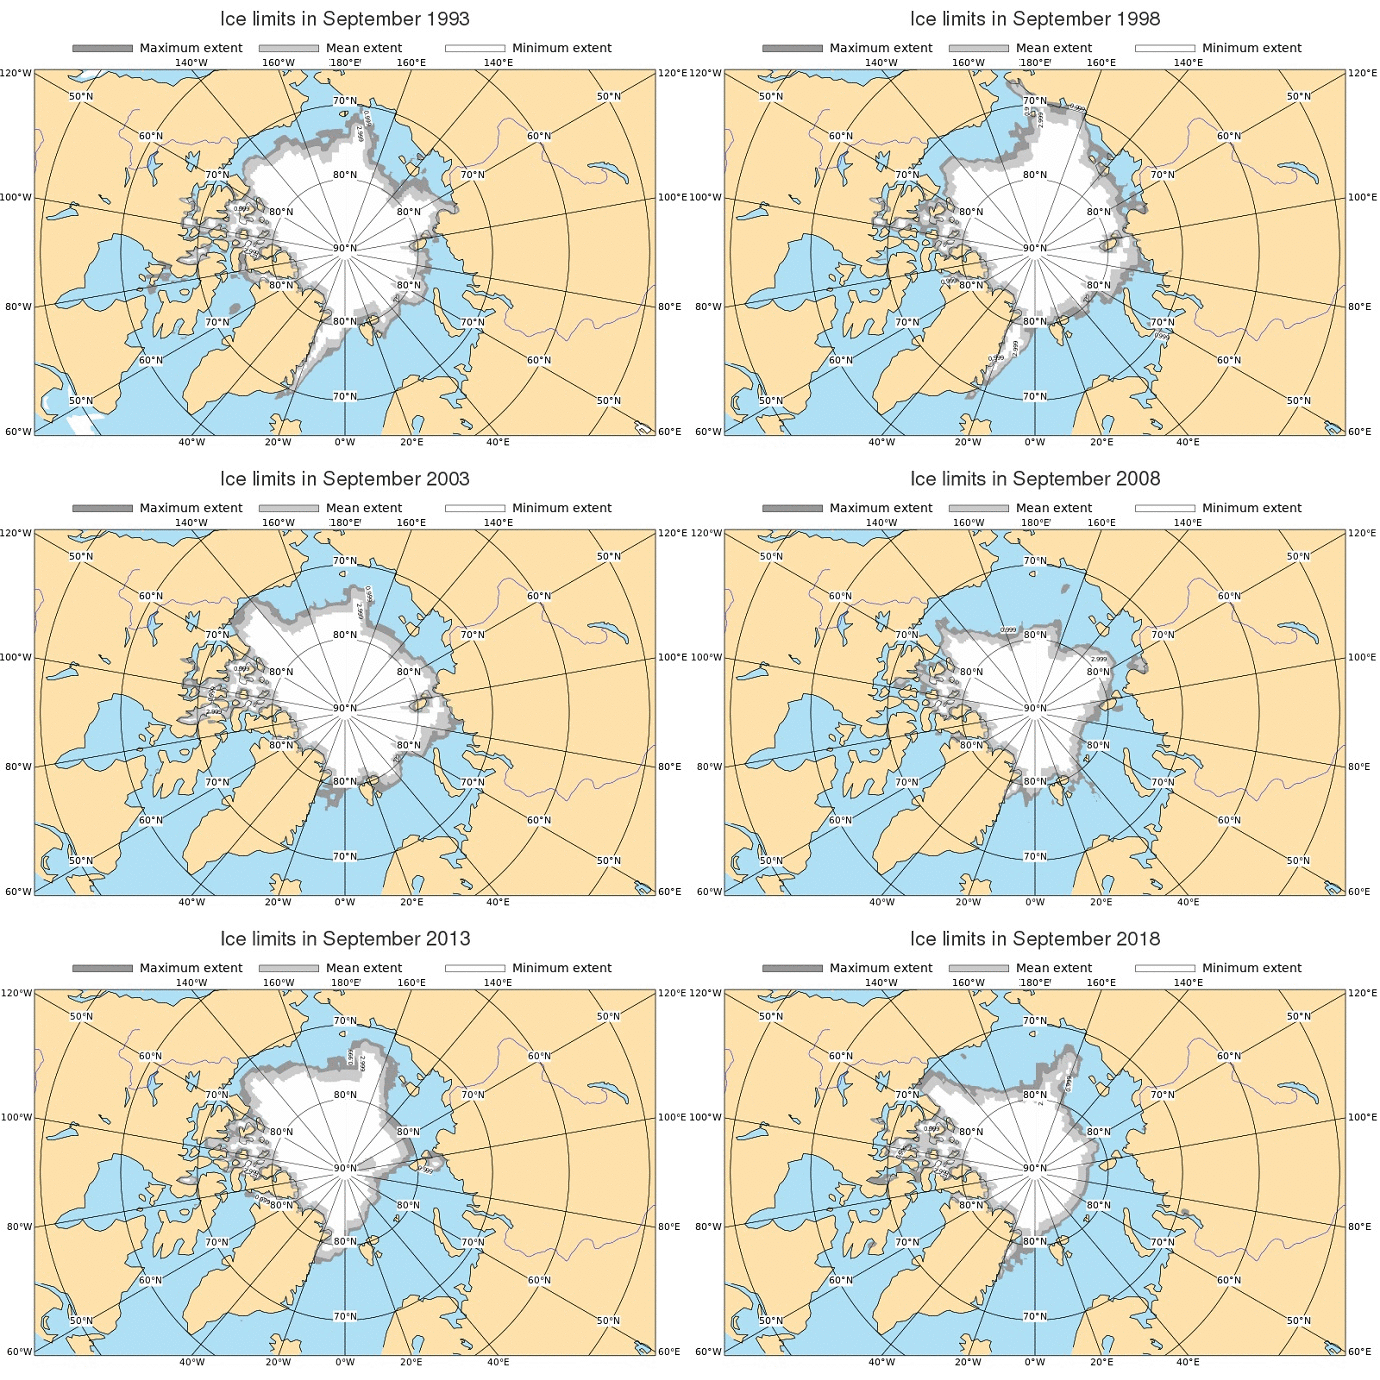
The Arctic sea ice extent application lets users scroll through monthly maps of sea ice extent covering the period from 1993 to 2018, based on ERA5 data.
Other data, such as climate projections and seasonal predictions, can also be viewed in dedicated applications. In addition, some of the many CDS datasets will soon come with a ‘View’ facility to enable users to visualise the data.
And here’s a piece of good news for anybody who can do a bit of coding using Python: the CDS Toolbox lets you create your very own applications using any of the data available in the Climate Data Store!
You may not have to write all your code from scratch. “If you want to use some of the code from an existing application, you can easily copy it over into your own,” James explains.
Of course, users can also download data. They can then process them at their end using tools of their choice.
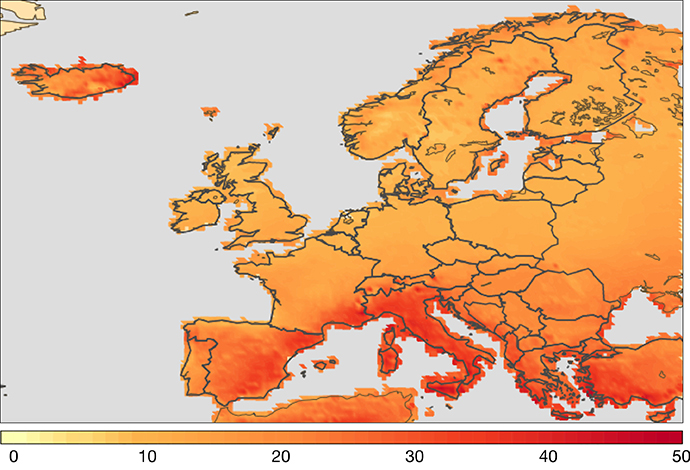
This chart adapted from a CDS climate projection application shows the number of heatwave days per year expected under a projected greenhouse gas concentration trajectory known as RCP4.5 for the period 2071 to 2100.
To download, users can either select data from predefined menus, or they can use a web API to specify their data requirements. Here too, to facilitate the job they can copy over Python code from the predefined menus into their data request.
Something for everybody
The principle behind the CDS is that it should work for a large range of potential users with different levels of expertise in coding or climate and weather science.
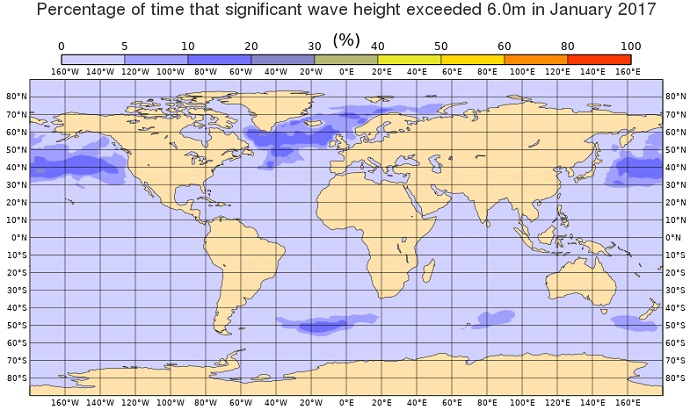
This map is from a CDS wave height application using ERA5 data.
“No matter how well you can code in Python, and regardless of whether you’re a scientist, a businessperson, a policy-maker, an educator, or anybody with an interest in climate and weather, the Climate Data Store has something for you,” says Cedric Bergeron, the Climate Data Store Manager.
There is, of course, always room for improvement. Channels for support and feedback include a contact form, the Copernicus Knowledge Base and the Copernicus User Support Forum.
“More data are being added to the CDS all the time, and more and more users are engaging with the CDS and giving us feedback,” says Carlo Buontempo, the Director of C3S. “We are constantly working to improve the tools available to users so that they can make the best possible use of the data. Expect the CDS to evolve in the future to even better serve our users!”
Further information
For more details on the technical implementation of the Climate Data Store, see this ECMWF Newsletter article.
