

Peter Lean joined ECMWF in 2014 to work on observation processing. On the introduction of continuous data assimilation, he says "it’s nice to work in an organisation where, when somebody has a good idea, everyone jumps in and works together to turn it into reality".
A change in the Integrated Forecasting System (IFS) planned for June this year will enable ECMWF to use more up-to-date weather observations to help define the initial conditions for its forecasts.
This shift towards more continuous data assimilation will significantly improve the quality of forecasts, which depend on the accuracy of the initial conditions.
The change was prompted by an internal talk given by ECMWF scientist Peter Lean and is the result of successful teamwork.
Peter’s interest in weather observations goes back to his teens, when he and his brothers used a kit to build a weather satellite receiver.
“It didn’t look like much – basically a cardboard box with wires sticking out of it – but it allowed us to see live views from polar-orbiting weather satellites from as far away as the Nile Delta and northern Greenland. I found it fascinating,” he says.
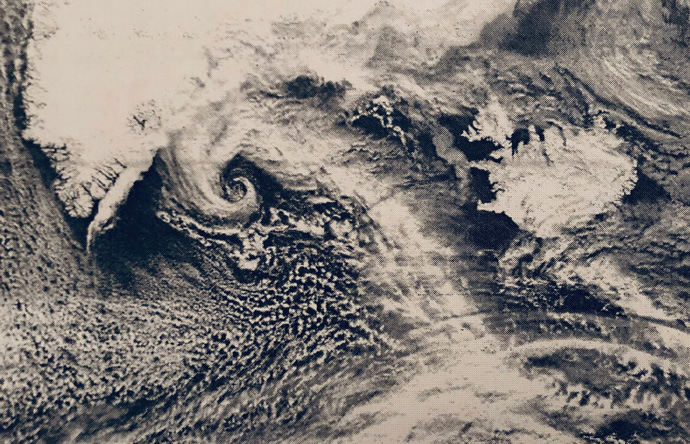
Example of a satellite image received by Peter in the early nineties using his homemade weather satellite receiver.
Peter went on to study geophysics for his first degree and specialised in numerical weather prediction for his master’s degree. After a PhD on the predictability of convective storms over the ocean, he worked on model development at the UK Met Office for a few years.
It was during postdoctoral work at NASA’s Jet Propulsion Laboratory in California and as a EUMETSAT research fellow at the University of Reading, UK, that his interest in working with satellite datasets was rekindled.
Since joining ECMWF in 2014, he has been working on various aspects of observation processing. One day in late 2017, he gave an internal seminar on how time is spent in ECMWF’s data assimilation system.
What happened next illustrates how teamwork can help to turn innovative ideas into reality.
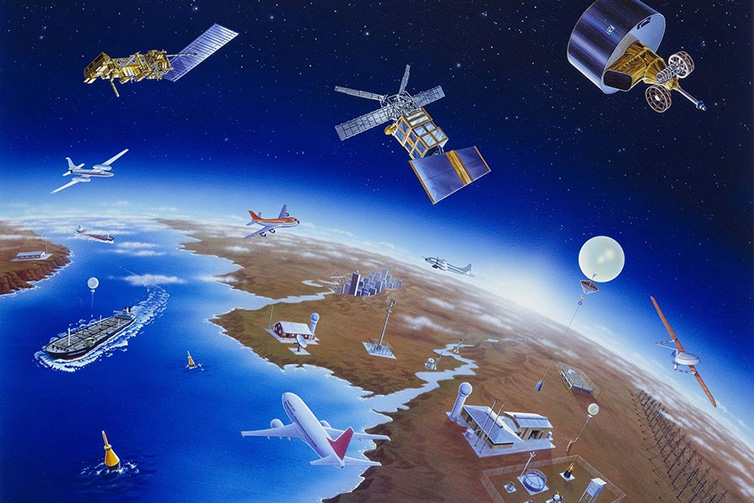
The global observing system provides a steady stream of observations of different components of the Earth system (atmosphere, land surface, ocean, waves and sea ice), which help to define the initial conditions on which forecasts are based.
Time gap
ECMWF’s 4D-Var data assimilation system combines weather observations with model information to obtain the best possible estimate of the current state of the Earth system.
That estimate, also called the analysis, is used as the starting point for weather predictions, so its accuracy is crucial for the quality of forecasts.
“In my presentation, I pointed out that there is a considerable delay between the time when the last weather observations that influence the analysis are made and the time when our supercomputer starts to calculate the forecast,” Peter recalls.
He explains that, in ECMWF’s current system, forecasts are based on observations made during a six-hour window, for example from 2100 UTC to 0300 UTC for a forecast starting at 0000 UTC.
After the end of the six-hour window, an hour is allowed for observations from that window to arrive at ECMWF. Only then does the data assimilation system swing into action to check the quality of the data and to calculate the analysis.
Those calculations take another hour to complete. By the time the forecast calculations begin, the most recent observations that have influenced the analysis are thus two hours old.
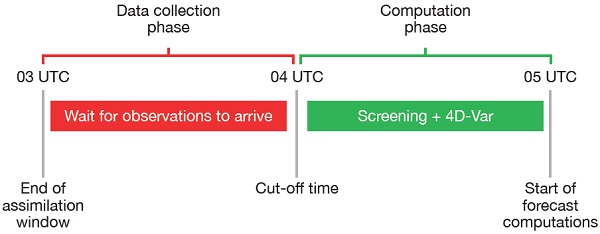
Schematic representation of the data collection and computation phases of the current operational data assimilation schedule.
Teamwork
“After the seminar, we discussed if there were any ways in which this delay could be reduced,” Peter recounts.
Among those in the audience was ECMWF scientist Tony McNally. He asked whether there was any reason why observations arriving later could not be added in between the loops used in the iterative analysis calculations. “There was some discussion and nobody came up with any fundamental obstacles,” Peter says.
Another colleague, Elías Hólm, suggested that the assimilation window could be extended right up to the start of the forecast calculations, to enable even more observations to be used. Again, it looked like a good idea.
A third scientist, Massimo Bonavita, had previously shown that adding an extra outer loop iteration of the data assimilation led to significant improvements in the quality of the analysis, although this was considered unaffordable.
Peter pointed out that if observations can arrive after the analysis calculations have started, those calculations might as well be started earlier to allow more expensive data assimilation configurations to be used. It was agreed that this too should be explored.
“It’s nice to work in an organisation where, when somebody has a good idea, everyone jumps in and works together to turn it into reality,” Peter says.
While considering how to implement the three ideas on the table, Peter and his colleagues came to realise that this new configuration was a variant of the continuous data assimilation concept that had been proposed in the mid-nineties by Heikki Järvinen, while working as a researcher at ECMWF.
Similar ideas had also been developed in parallel by Carlos Pires and colleagues in France, and later continuous data assimilation was even used operationally for a while at Environment Canada.
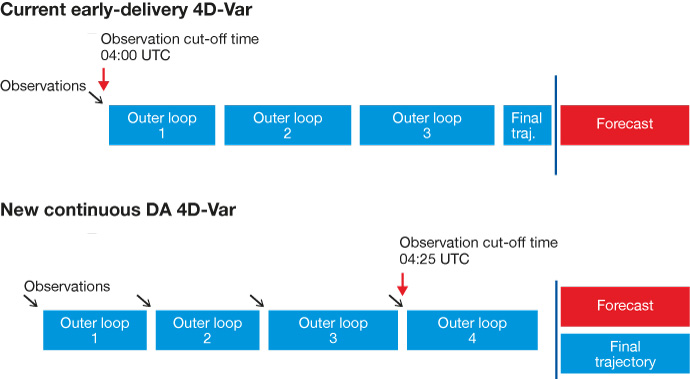
Schematic representation of the current 4D-Var configuration and the proposed more continuous data assimilation (DA) configuration. The black arrows indicate at which stage of the 4D-Var computations new observations are ingested. The blue vertical line shows the time when the forecast computations start, which is unchanged.
Tests
Experiments confirmed that the new configuration would make it possible for a much greater number of observations to influence the analysis.
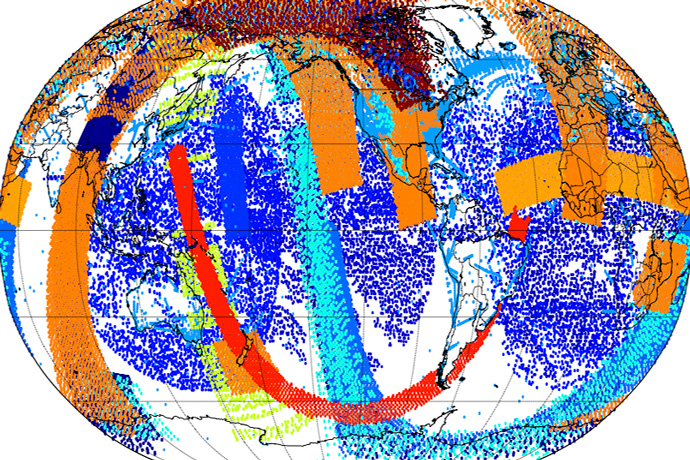
Example of extra observations assimilated in a single continuous data assimilation cycle compared to the current operational setup. They include satellite observations from a range of instruments as well as in situ measurements.
They also showed that adding observations while analysis calculations are under way does not lead to any numerical instabilities.
Finally, they confirmed a significant improvement in forecasts as a result of the new, more continuous configuration.
“The additional observations are mostly particularly recent ones, as we can now assimilate observations taken around one and a half hours later than in the current system. These observations are especially valuable for data assimilation as they contain the most up-to-date information,” Peter explains.
Once every aspect of the new configuration had been thoroughly tested, it was decided to include it in the next IFS upgrade, IFS Cycle 46r1, scheduled for implementation in June 2019.
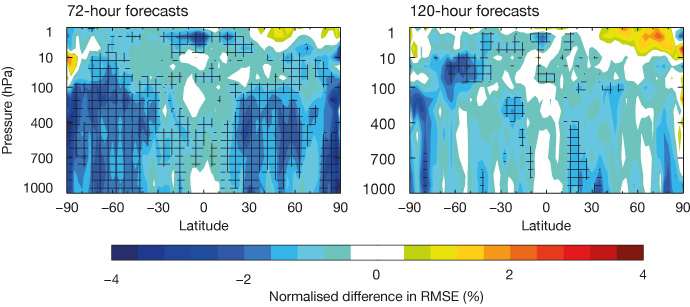
Zonal (east–west) mean difference in root-mean-square error (RMSE) between forecasts of vector wind produced using the current early-delivery data assimilation configuration on the one hand and continuous data assimilation on the other, for lead times of 72 hours (left) and 120 hours (right), verified against the operational analysis. Negative values indicate smaller RMSE when using continuous data assimilation. Hatched areas indicate statistically significant changes at the 95% confidence level. The plots are based on six months of experimentation covering December 2016 to August 2017.
Outlook
The implementation of IFS Cycle 46r1 does not mark the end of efforts to make the best possible use of observations in data assimilation.
One of the options being worked on is more continuous observation processing. “We are moving towards a near-continuous framework for the pre-processing and initial quality control of weather observations,” Peter says.
He adds that continuous data assimilation opens the door to exciting new developments, such as using more computationally expensive but more accurate data assimilation configurations.
“In principle, we can envisage a data assimilation system that is continuously providing updated estimates of the current state of the Earth system based on a steady stream of new observations.”
More details on the continuous data assimilation configuration in IFS Cycle 46r1 and plans for the future can be found in the winter 2018/19 issue of the ECMWF Newsletter.
