
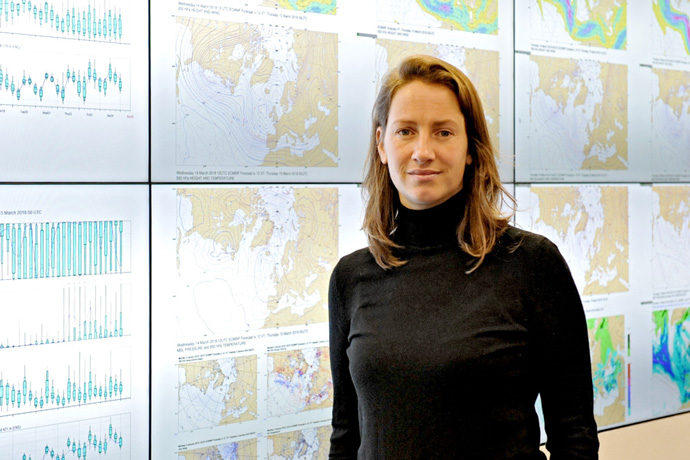
Melanie Ades joined ECMWF in September 2016.
As ex-hurricane Ophelia hurtled towards Ireland in October 2017, the sky over parts of Europe turned red. ECMWF scientist Melanie Ades works on the satellite observations that help us to understand why.
When Melanie decided on her first degree course, it was far from clear that she might one day end up working on satellite data assimilation for the EU-funded Copernicus Atmosphere Monitoring Service (CAMS) operated by ECMWF.
As an accomplished flautist, she opted for a music degree. But she never forgot her passion for fractals and chaos theory first kindled in her while studying A-level maths.
Work for the UK Met Office as part of a company placement prompted her to complete a second degree course, in maths and computing, with a view to moving into meteorology.
“The bits of maths you need for data assimilation, such as probability theory, statistics and linear algebra, is what I loved most during my degree course,” she says.
There followed a PhD and postdoctoral work in data assimilation: the combining of Earth system observations with models to produce a best-estimate initial state for forecasts.
Following a first job in natural catastrophe modelling, she obtained a position as a scientist in the CAMS Development Section.
“I really liked the idea of doing work which helps to provide information on issues important to society, such as air quality.”
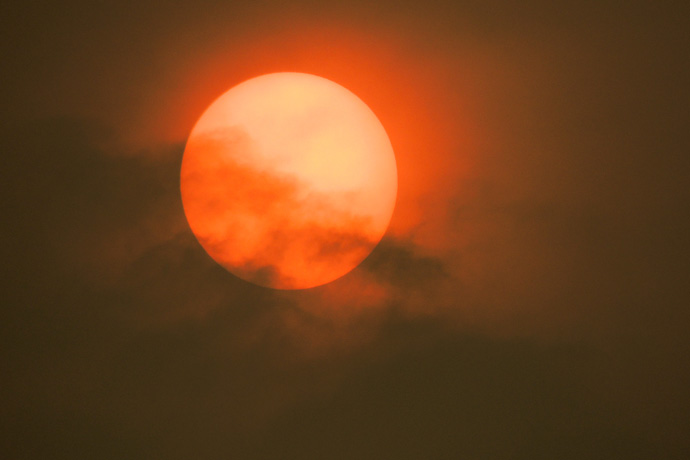
In October 2017 the sky turned red over parts of Europe. (Photo: Inner_Vision/iStock/Thinkstock)
Understanding the red sky
The case of Ophelia illustrates what is at stake in Melanie’s work. Why did the sky turn red? Was there anything to worry about?
Melanie’s job is to optimise the use of satellite data that can help to provide the answer.
The data is combined with models to analyse the atmosphere’s current composition and to predict its evolution.
CAMS uses two types of observations of atmospheric composition: satellite data and ground-based observations.
“The former have the advantage that they cover the entire globe,” Melanie says. “That is why we use them in our data assimilation system to help analyse the atmosphere.”
“The latter are indispensable to calibrate the satellite data and to validate our models.”
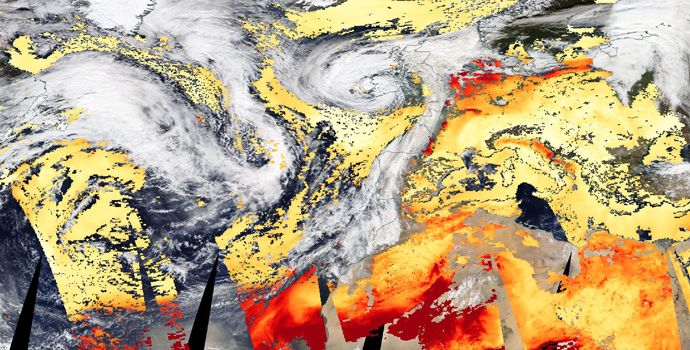
Observations of aerosol optical depth on 16 October 2017 from the MODIS instruments on board the Aqua and Terra satellites, one of the sets of observations used operationally by CAMS. The cloud cover associated with Hurricane Ophelia prevented observations over Ireland and most of the UK. (Image: NASA Worldview)
Satellite data provided vital information on the transport of aerosols from northwest Africa and the Iberian Peninsula towards northwest Europe in the strong southerly flow caused by Ophelia.
Aerosols are tiny particles in the atmosphere, such as desert dust, black carbon from wildfires, sea salt and sulphates. At high concentrations they can have implications for air quality and human health.
Satellite instruments measure radiation levels at the top of the atmosphere. From this the aerosol optical depth (AOD) of an atmospheric column can be calculated, which in turn provides information on the amount of aerosols in that column.
There are, however, a few limitations to the satellite data: the instruments can only detect aerosols in cloud-free conditions; they cannot see the vertical distribution of the aerosols; and they cannot identify which types of aerosols are in the column.
“The data assimilation process fills the gaps by combining the satellite data with a previous short-range forecast,” Melanie explains. “This means we can tell that around the time of Ophelia both organic matter from wildfires in Portugal and desert dust were transported to northwest Europe.”
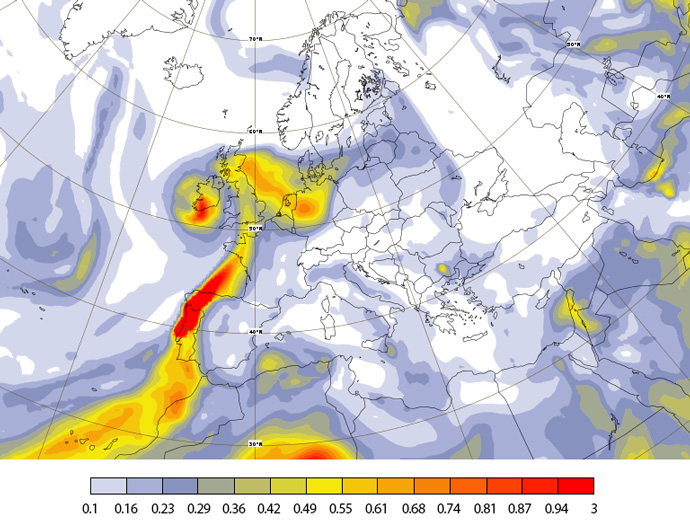
This is a 12-hour CAMS forecast of AOD at a wavelength of 550 nm valid at 12 UTC on 16 October 2018, when ex-hurricane Ophelia was located over Ireland. Such charts are available from the CAMS website for individual aerosols or combinations of them for 5-day forecasts starting at 00 UTC and 12 UTC.
CAMS data is also available for individual aerosols and chemical species. The data can be combined in various ways to produce customised maps and animations.
CAMS data show that Ophelia transported both Saharan dust and aerosols from wildfires in Portugal towards northwest Europe. (Animation: ECMWF/CAMS)
Vertical resolution
One of Melanie’s current projects is to explore the use of increased vertical resolution in the atmospheric composition model used by CAMS.
“In principle greater vertical resolution brings clear benefits: it allows us to track more closely fine details in the distribution of aerosols and chemical species,” Melanie says.
“But we have to be careful about adjusting our assumptions about uncertainties in the model correctly,” she adds.
Currently CAMS assumes static errors in the short-range forecasts that are compared with observations.
Melanie is working on introducing less rigid error assumptions while maintaining computational efficiency.
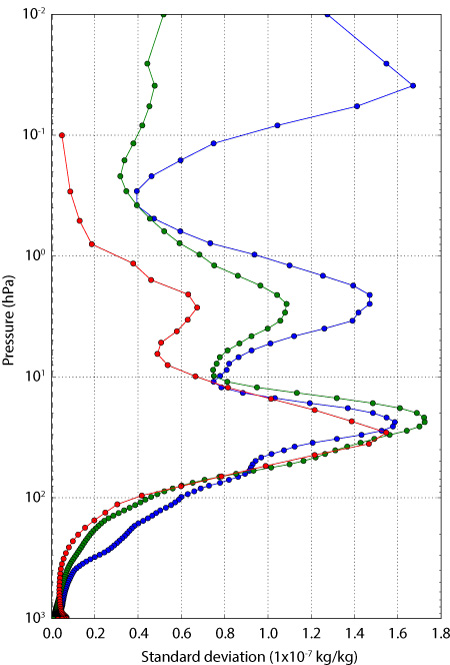
The chart shows different vertical profiles of short-range forecast uncertainties for ozone, expressed as the standard deviation between 24-hour and 48-hour forecasts. The red line shows uncertainties for the current vertical resolution (60 levels), while the blue and green lines show uncertainties for two possible higher-resolution alternatives (137 levels). The clear differences in uncertainty affect the relative weight that should be attached to observational and model information at different levels. This in turn has an impact on the analysis and forecasts for ozone.
Working with satellite agencies
A lot of work goes into planning and developing the satellite missions that support global atmospheric composition forecasts.
“I liaise with agencies such as EUMETSAT and ESA on the kind of data we need from new satellite missions, and on the information we can provide to them to help them turn the measurements made by satellite instruments into useful products,” Melanie says.
Part of her job is to help introduce new data streams into the model. The latest example is her involvement in assessing test data from the Sentinel-3A satellite launched in February 2016.
The Sentinel family of satellites is part of the EU’s Copernicus Earth observation programme. Based on satellite and in situ observations, six Copernicus services deliver near-real-time data to help understand Earth and sustainably manage the environment.
“The huge data volume coming from new satellites can be transformed mathematically into more manageable amounts for certain chemical species. My job is to investigate whether the transformed data meet our needs,” Melanie says.
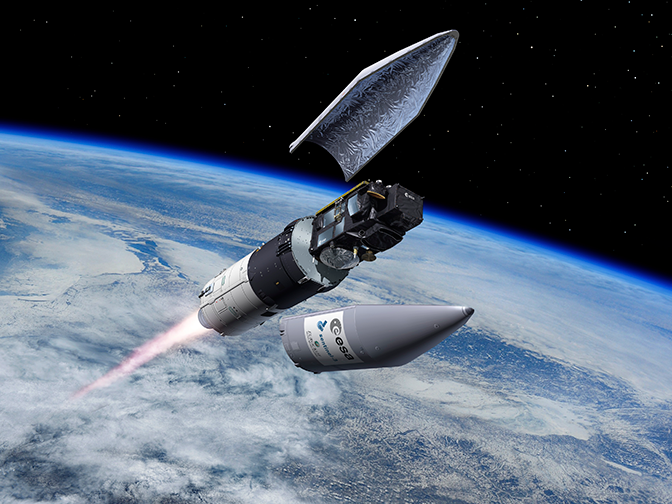
The Sentinel-3A satellite was launched in February 2016. (Image: ESA/Pierre Carril)
“We compare test data with the data we currently use and evaluate the impact of the new data on forecast quality. Ultimately better analyses and forecasts are the yardstick by which our work will be judged.”
