

Kristian Mogensen joined ECMWF in 2004 to work on seasonal forecasts.
Since 5 June 2018, rapid interactions between the ocean, sea ice and the atmosphere have been included in ECMWF’s highest-resolution weather forecasts. ECMWF scientist Kristian Mogensen has helped to make this latest move towards seamless Earth system modelling.
Like many of his colleagues in the Research Department, Kristian is a physicist by training. As part of his PhD in applied physics, he acquired extensive computer modelling skills.
This proved useful when he joined the Danish meteorological service (DMI) in 1998 to work on data assimilation in numerical weather prediction (NWP). Six years later he joined ECMWF, initially to work on seasonal forecasts.
“In seasonal forecasts, ocean–atmosphere interactions are very important. This is how I came to specialise in this area,” he says.
Kristian points out that the ocean surface and sea ice are the lower boundary of the atmosphere over most of the globe. Sea-surface temperature and sea-ice concentration must therefore be included as boundary values in any global NWP model.
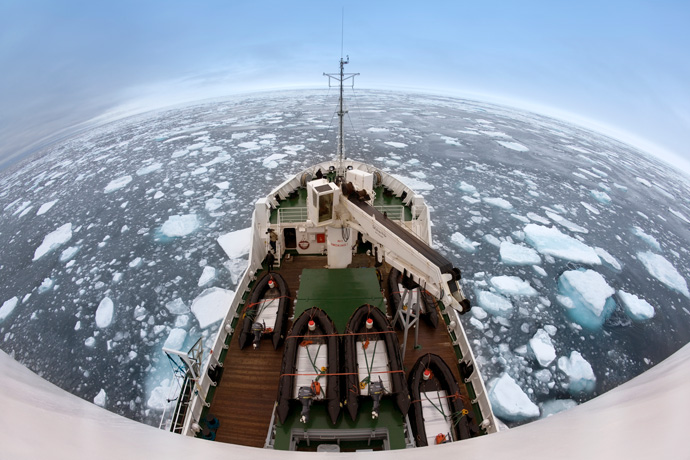
Over most of the globe, the ocean surface is the lower boundary of the atmosphere. (Photo: Thinkstock/iStock/SteveAllenPhoto)
The question is: can we assume a constant ocean and sea-ice state for the duration of the forecast? Or do we need a dynamic model in which the ocean and sea ice evolve as a result of interactions between the ocean, sea ice and the atmosphere?
It was long assumed that, for medium-range forecasts up to about 10 days, dynamic interactions can be ignored.
“Today we know that there are situations where such interactions matter,” Kristian says. “The trend has therefore been to increase the coupling of the atmosphere, the ocean and sea ice in ECMWF’s Integrated Forecasting System (IFS) – and we have not yet reached the end of the road.”
Importance of coupling
The power of coupling is well illustrated by the impact a blast of cold air from the east had on sea-surface temperatures (SSTs) in the North Sea last winter.

More realistic SSTs. The uncoupled 9-day forecast of SSTs for 5 March 2018 (left) is much warmer than the coupled forecast (middle), which matches the analysed SSTs (right) much better.
“The colder SSTs in the coupled forecast in turn had an impact on temperature forecasts, including over land, with lower 2-metre temperatures predicted over parts of Britain than in the uncoupled forecast,” Kristian says.
Measurements at a North Sea weather buoy marked by the black diamond in the charts confirm that SSTs in the coupled forecast closely matched the observed evolution of SSTs over the course of the forecast period.
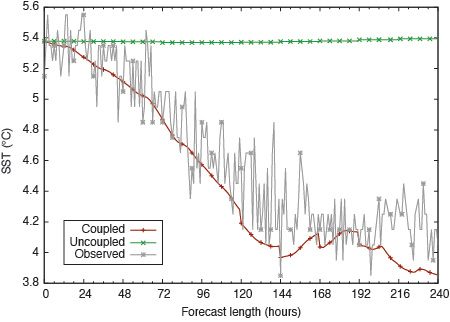
Close match. The SSTs predicted by the coupled system closely matched the SSTs observed by a North Sea weather buoy.
Kristian gives two more examples of situations in which coupling is important.
The first is tropical cyclones. Their main energy source is heat transport from the ocean into the atmosphere.
If there is only a shallow top layer of warm water, the amount of energy that is released into the atmosphere may diminish relatively quickly. The water cools and the cyclone begins to weaken.
“Not coupling the atmosphere and the ocean in the forecast model means that the ocean acts as an infinite source of energy. This may allow the cyclone intensity in the forecast to increase unrealistically,” Kristian says.
Typhoon Neoguri, which hit Japan in July 2014, is an example where coupling makes a difference.
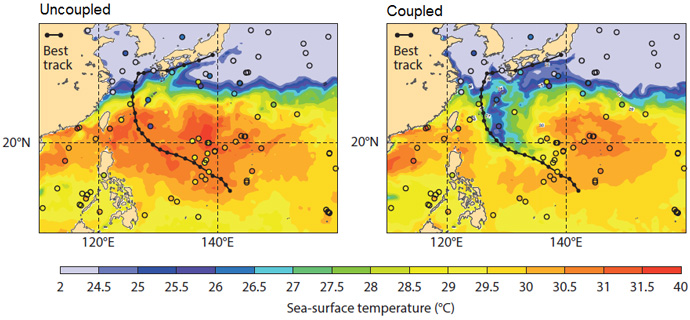
Neoguri-ocean interaction. Five-day SST forecasts for the area of Neoguri starting on 5 July 2014 using the uncoupled model (left) and the coupled model (right). SST observations from ships and buoys (circles) confirm that the coupling leads to more realistic SST predictions along the path of the cyclone (‘best track’ data – black line).
The second example is rapid changes in sea-ice concentration in the polar regions.
Such changes are particularly frequent in the summer, when some of the ice melts, and in the autumn, when it can form rapidly. Changes in sea-ice concentration can also be wind-driven.
“Sea-ice concentration matters for weather forecasts as it influences heat fluxes between the surface and the atmosphere. This means it can have a strong impact on near-surface air temperature,” Kristian explains.
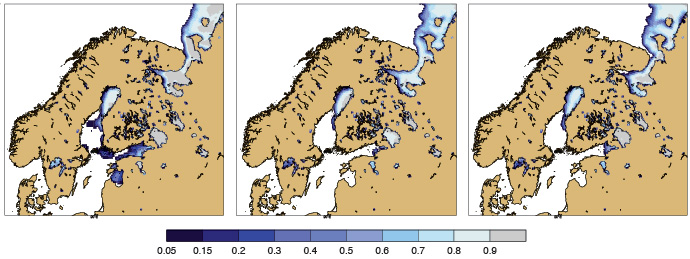
More realistic sea ice. Sea-ice concentration in the Baltic Sea evolved considerably between 1 April (left) and 11 April 2018 (middle), according to ECMWF’s OCEAN5 analysis. ECMWF’s coupled high-resolution 10-day forecast for 11 April (right) was able to capture these changes.
Problems and solutions
While the case for coupled forecasts is clear, implementing them operationally is not straightforward.
To mention just three difficulties:
- the initial conditions for the different models may be inconsistent
- the models generally use different grids and time steps
- errors in one model can amplify errors in another
“That is why naively coupling ocean, sea-ice and atmospheric models does not by itself guarantee better forecasts,” Kristian warns.
“A lot of work goes into getting the initial conditions right, optimising the interpolation and time stepping between models, and preventing feedbacks that amplify errors.”
ECMWF couples an atmosphere–land–wave model with the community ocean model NEMO and the LIM2 sea-ice model developed at the Belgian Université catholique de Louvain.
Tests have shown that using SSTs from NEMO from day 0 in the coupled model has mixed results: it improves temperature forecasts in the tropics in the medium range but tends to degrade them in the extratropics at shorter lead times.
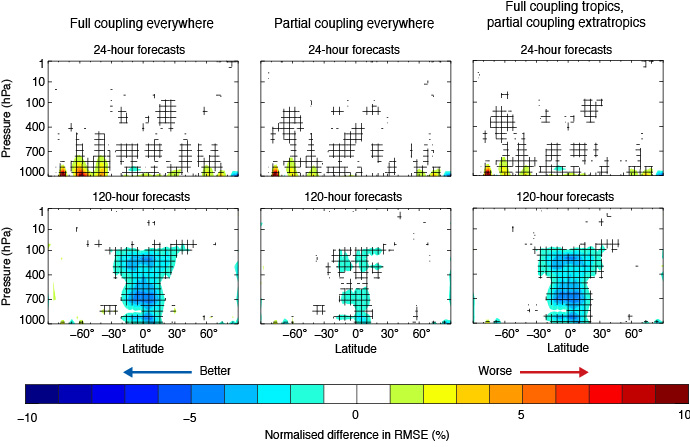
Minimising temperature forecast errors. The plots show the normalised difference in root-mean-square error (RMSE) between uncoupled temperature forecasts and forecasts with full coupling everywhere (left), partial coupling everywhere (middle) and partial coupling in the extratropics and full coupling in the tropics (right). The latter option limits the increase in errors in the extratropics while reaping full benefits from the coupling in the tropics. Cross-hatching indicates 95% confidence.
“The reason for the increase in errors in the extratropics is the relatively coarse resolution in the ocean model,” Kristian says. “It means that ocean eddies, for example in the North Atlantic, cannot be resolved by the model.”
To mitigate this problem, ECMWF has introduced ‘partial coupling’ up to day four of the forecast: the atmosphere sees the fine-scale SST of the atmospheric initial conditions with added larger-scale tendencies from the ocean model.
In the IFS upgrade implemented on 5 June, in the tropics SSTs from the ocean model are now used from day 0, while in the extratropics partial coupling still applies to day 4, followed by a gradual transition to full coupling.
Tests have shown that in this way the benefits of coupling can be maximised.
Kristian adds that future improvements may come from better representing some physical processes in the coupled model. These include interactions between the atmosphere and the top few millimetres of the ocean.
However, any changes to the coupled model configuration must pass rigorous tests before they can be implemented.
“The goal is to improve forecasts for our users: a coupled forecast system is a means to an end rather than an end in itself.”
