
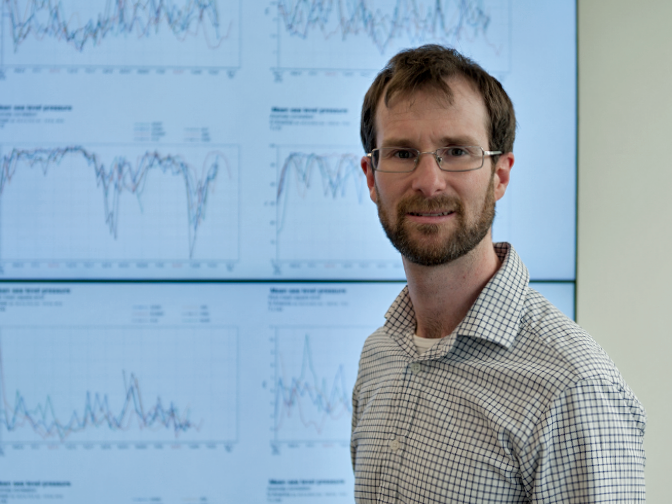
Linus Magnusson has been working in the Diagnostics Team at ECMWF since 2011. One of his key tasks is to track down the causes of differences between the Centre’s weather forecasts and observed outcomes.
What exactly is it in the forecasting model, or in atmospheric conditions, that makes some forecasts go wrong?
And conversely, in what kind of conditions do forecasts tend to be particularly good, and why?
Dr Magnusson has been a keen observer of atmospheric conditions since his teens, having obtained a glider pilot licence at the age of 16.
“Being close to the clouds and relying on weather predictions got me interested in forecasting and led me to join the weather service in the Air Force during my military service,” he recounts.
It marked the start of a career in meteorology. After completing a PhD in dynamic meteorology and ensemble forecasting at the University of Stockholm, Dr Magnusson joined ECMWF in 2009.
Two approaches
There are broadly two approaches to understanding the sources of errors in ECMWF’s forecasts.
One is to start from mean forecast scores to establish in which areas of the globe or in which atmospheric conditions the errors are particularly large.
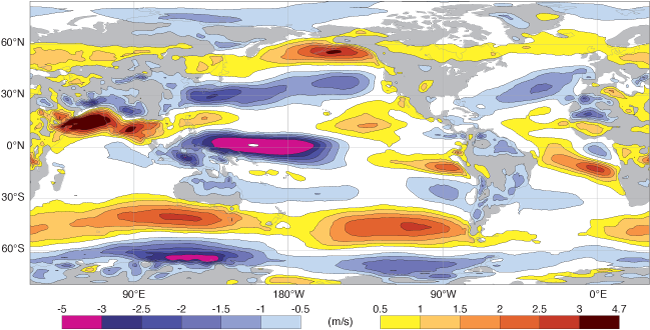
Mapping the distribution of mean errors can be a starting point for investigations into why forecasts sometimes go wrong. The chart above shows the mean error in the zonal wind component at the 850 hPa level in seasonal forecasts for June, July and August, averaged over the period 1981 to 2010. It highlights problems in forecasts of the Indian summer monsoon and of winds over the western tropical Pacific.
“For example, if you investigate 2-metre temperature errors, you may want to look at them in clear conditions on the one hand and cloudy conditions on the other to see whether they are sensitive to these properties. Such an investigation may reveal if the errors are systematic or random,” Dr Magnusson explains.
Scientists working on model development can then try to figure out what in the model causes the errors to be large in those particular conditions.
The other approach is to try to understand where predictability comes from in individual cases. “You can take good forecasts and try to work out what caused them to be good, or bad forecasts to work out what caused them to be bad.”
Heat wave
Understanding forecast performance for extreme events is of special importance due to their impact on people.
An example is last summer’s heat wave in Europe, which ECMWF’s model predicted “reasonably well”.
The heat wave was accompanied by a large anomaly in sea-surface temperature in the North Atlantic. It also came at a time of dry soil conditions after a dry spring. Either factor could have contributed to the development of the heat wave.
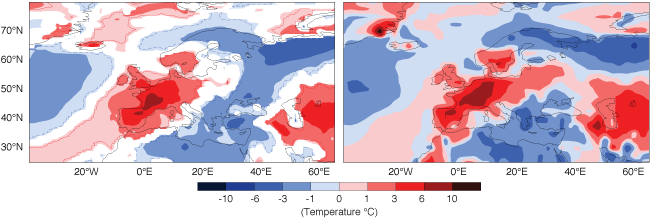
ECMWF’s 2-metre temperature forecast initialised on 22 June 2015 (left) shows the difference between predicted and average climatological temperatures for the period 29 June to 5 July 2015, which marked the start of a protracted heat wave in many parts of Europe. This 1 1/2-week forecast corresponds reasonably well to average observed conditions (right). In the white areas, the forecast is not significantly different from average climatological conditions.
Dr Magnusson carried out experiments, adjusting the sea-surface temperature and soil moisture in the model. He found that forecasts of the heat wave were sensitive to soil moisture but not sea-surface temperatures.
“Had the soil been moister, the temperature in the forecast would have been lower, so the high quality of the forecast depended on us capturing the soil moisture anomaly,” he points out.
Tropical cyclones
Fixing the causes of errors is not always easy. In some cases forecast errors are big because the atmospheric conditions were particularly unpredictable. But in others forecasts can be improved by changing the use of observations or making changes in the model.
Dr Magnusson gives the example of tropical cyclones. Errors in their predicted structure were recently traced to unrealistic temperature patterns, which were in turn caused by errors in calculating the trajectory of air parcels in very strong winds.
Scientists in the Centre’s Research Department were able to resolve the problem by increasing the number of iterations used in the air parcel calculations.
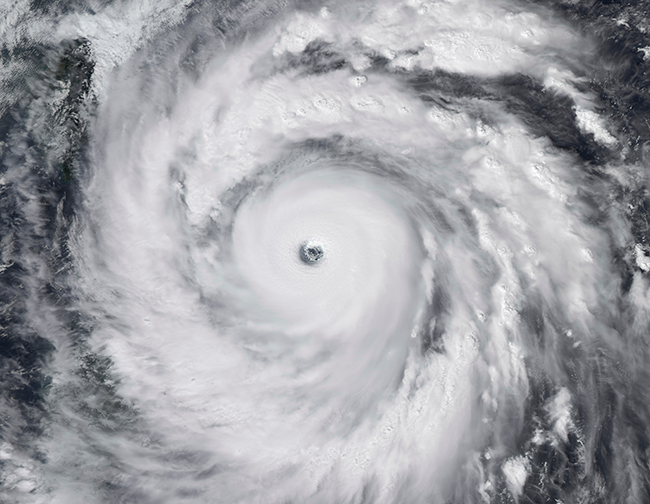
Some errors in the prediction of tropical cyclones have been removed by adjusting the numerical methods used in the model. (Image: Thinkstock/Stocktreck Images)
“This is an example where identifying the error and pinpointing the cause has led to changes in the operational model which have improved forecast quality,” Dr Magnusson says.
The limits of predictability
On 14 April, Dr Magnusson gave a talk on predictability at the Annual Meeting of the Nordic Association of Electricity Traders.
He points out that energy companies are demanding customers: they need to know shifts in temperature patterns, which influence energy demand, as long in advance as possible.
“My talk was about the predictability of shifts in large-scale patterns. In some conditions predictability is better than in others and forecast users need to understand that,” he observes.
For example, he has been able to trace a case of poor temperature forecasts for Europe last autumn to small errors in the prediction of an intense low over the north-eastern Pacific. These led to errors in the prediction of another low, over the Great Lakes, and those ultimately led to a poor forecast for Europe.
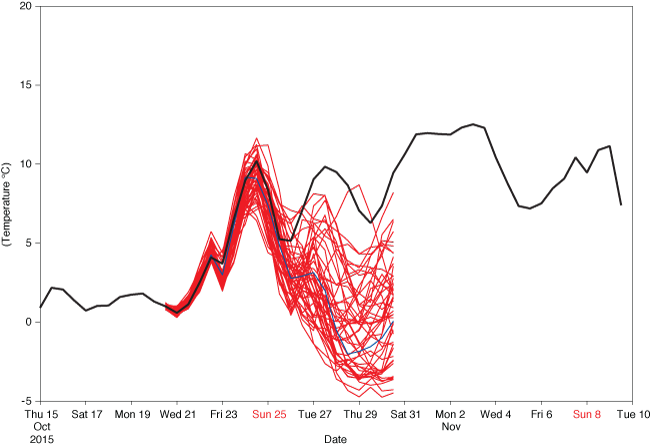
This forecast of 850 hPa temperature over Germany from 21 October 2015 was good up to four days ahead: the high-resolution forecast (HRES - blue line) and most members of the lower-resolution ensemble forecast (ENS – red lines) closely matched the observed temperature evolution (black line). However, for the period after 25 October both HRES and most ENS members predicted much lower temperatures than what was observed.
A related focus of Dr Magnusson’s work is on weather regimes in which the normal west-to-east progression of cyclones and anticyclones is blocked.
“We’d like to extend our ability to predict such regimes. Therefore, I and my colleagues Mark Rodwell and Laura Ferranti in the Diagnostics Team are developing ways to measure our performance in this area and to identify avenues for improvement,” he says.
“Our colleagues in the Research Department can then use our findings to develop the forecasting model.”
