
Climate reanalysis has huge benefits for numerical weather prediction (NWP) as well as climate studies, and it can help to shed new light on the pace of global warming, two of ECMWF’s top reanalysis experts have said in separate high-profile interventions.
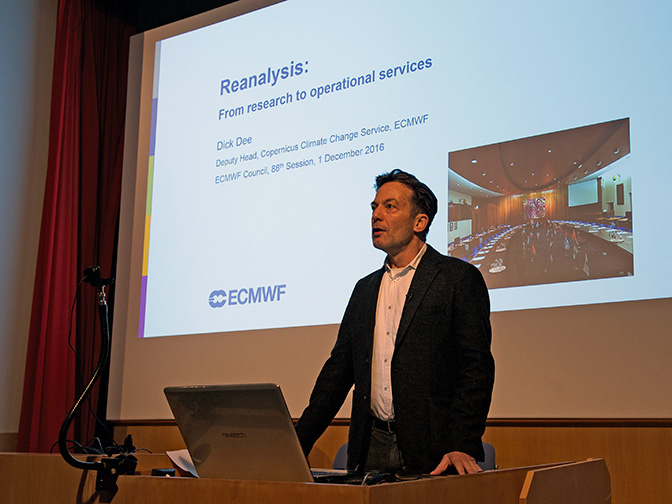
Climate reanalysis provides a numerical description of the recent climate by combining models with observations. Its benefits were set out by Dick Dee in a lecture livestreamed to a global audience at the end of an ECMWF Council meeting on 1 December.
Dr Dee explained that climate reanalysis at the Centre has come a long way since the eighties, when ECMWF together with scientists worldwide produced the first global atmospheric dataset available for scientific research.
A series of progressively more sophisticated and higher-resolution reanalyses followed, including ERA-Interim, which covers the period from 1979 and is updated continuously.
ERA5, the latest ECMWF reanalysis, is now in production. Dr Dee pointed out that it uses a version of the Centre’s Integrated Forecasting System (IFS) launched as recently as March 2016, provides hourly output from 1979, and comes with uncertainty estimates.
Reanalysis has also been extended to the oceans and atmospheric composition, and it has been extended back in time to cover the entire 20th century, he added.
Separately, a new study led by ECMWF scientist Adrian Simmons shows that reanalysis data can help to reassess evidence of a recent slowdown in global warming.
A report on the findings has been published in the Quarterly Journal of the Royal Meteorological Society and has been showcased by publisher Wiley in a press release.
Reanalysis and NWP
Fundamentally, climate reanalysis and NWP work in the same way: observations are assimilated into a model of the atmosphere and related parts of the Earth system to produce a complete representation of the state of the atmosphere at any given time.
In NWP, this process is used to make predictions. In climate reanalysis, it is used to reconstruct the climate and weather of the past.

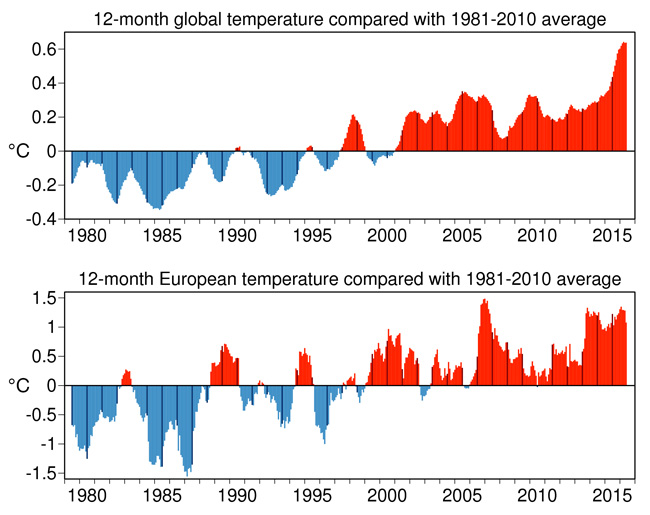
ERA-Interim data has been used to produce these charts of running twelve-month averages of global-mean and European-mean surface air temperature anomalies relative to 1981-2010, based on monthly values from January 1979 to November 2016. The darker coloured bars are the averages for each of the calendar years from 1979 to 2015. (Source: ECMWF, Copernicus Climate Change Service)
“The close relationship means that reanalysis reveals a great deal about the quality of the forecast model,” Dr Dee observes.
“It can lead to new ways to make better use of observations and it can expose technical problems in the forecasting system.”
In particular, the ‘frozen’ forecasting system used in reanalysis provides a benchmark against which improvements can be measured: if there are gains in forecast quality relative to the reanalysis system, it must be because of changes in the forecasting system, and not because the atmosphere happened to be more predictable or better observed over the verification period.
Finally, reanalysis is essential for forecast products predicting anomalous or extreme weather. These require a reference climate, which reanalysis helps to provide.

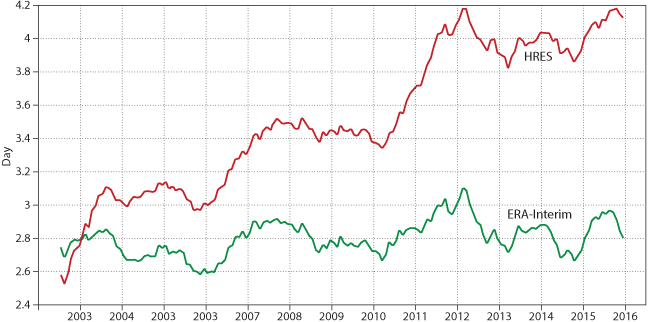
Evolution of forecast skill. The chart shows that some of the variability in forecast skill in ECMWF’s high-resolution forecasts (HRES) over the years is the result of variability in atmospheric predictability and the quality of the atmospheric observing system, which are responsible for the fluctuations in the ERA-Interim scores. The difference between HRES and ERA-Interim skill gives an indication of the gains made as a result of successive improvements to the forecasting system. The evolution of forecast skill is shown here in terms of the forecast lead time at which the SEEPS score for HRES and ERA-Interim forecasts of 24-hour total precipitation reaches 45% for the extra-tropics.
Reanalysis and research
Reanalysis datasets are also “extremely popular” with researchers across the world studying climate and weather, Dr Dee emphasises.
He points out that, in 2015, the web service giving access to ERA-Interim data had some 20,000 users worldwide, including about 2,000 in Europe.
He adds that scientific publications currently refer to the original ERA-Interim paper at a rate of about 180 new citations a month.
“Reanalyses provide researchers with complete and realistic representations of atmospheric processes which they can use to study weather and climate phenomena,” Dr Dee says.
Reanalysis and climate services
ECMWF has taken climate reanalysis from research into operations by running the EU-funded Copernicus Climate Change Service (C3S).
“Reanalysis has thus become a cornerstone for the development of climate services in Europe,” says Dr Dee, who is the Deputy Head of C3S.
He points out that C3S, which is still at an early stage of development, already uses ERA-Interim data to produce monthly climate reports.

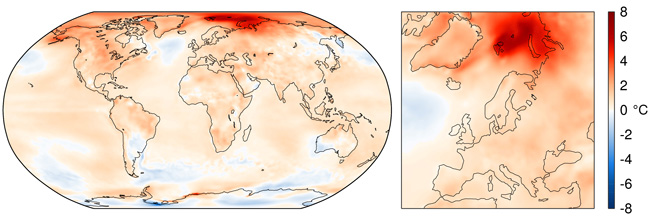
ERA-Interim data were used to produce these maps of surface air temperature anomalies for the 12 months ending November 2016 relative to the average for 1981-2010. (Source: ECMWF, Copernicus Climate Change Service)
C3S also aims to deliver climate services tailored to the needs of different economic sectors, such as the insurance industry and the energy sector, Dr Dee explains.
Climate change
A new study led by ECMWF scientist Adrian Simmons underscores the importance of climate reanalysis as a source of information on climate change.
By analysing a number of datasets including climate reanalyses, Professor Simmons and his co-authors were able to show that global warming may have slowed rather less from 1998 to 2012 than first thought.
Their article in the Quarterly Journal of the Royal Meteorological Society also documents that global temperature peaked in February 2016 at a level around 1.5°C above its level early in the Industrial Revolution.
Pursuing efforts to limit the long-term temperature increase to 1.5°C was a goal set in the Paris Agreement reached in 2015.
“It is salutary to note that the world touched the 1.5°C level less than 20 years after touching the 1°C level in the then record-breaking year of 1998, in both cases following a strong El Niño,” Professor Simmons said.
